Supported by Dr. Osamu Ogasawara and  . . |
|
Last data update: 2014.03.03 |
Date and Date-time Plotting FunctionsDescriptionFunctions to plot objects of classes Usageaxis.POSIXct(side, x, at, format, labels = TRUE, ...) axis.Date(side, x, at, format, labels = TRUE, ...) Arguments
Details
If The date-times for a The way the date-times are rendered (especially month names) is
controlled by the locale setting of category ValueThe locations on the axis scale at which tick marks were drawn. See AlsoDateTimeClasses, Dates for details of the classes.
Examples
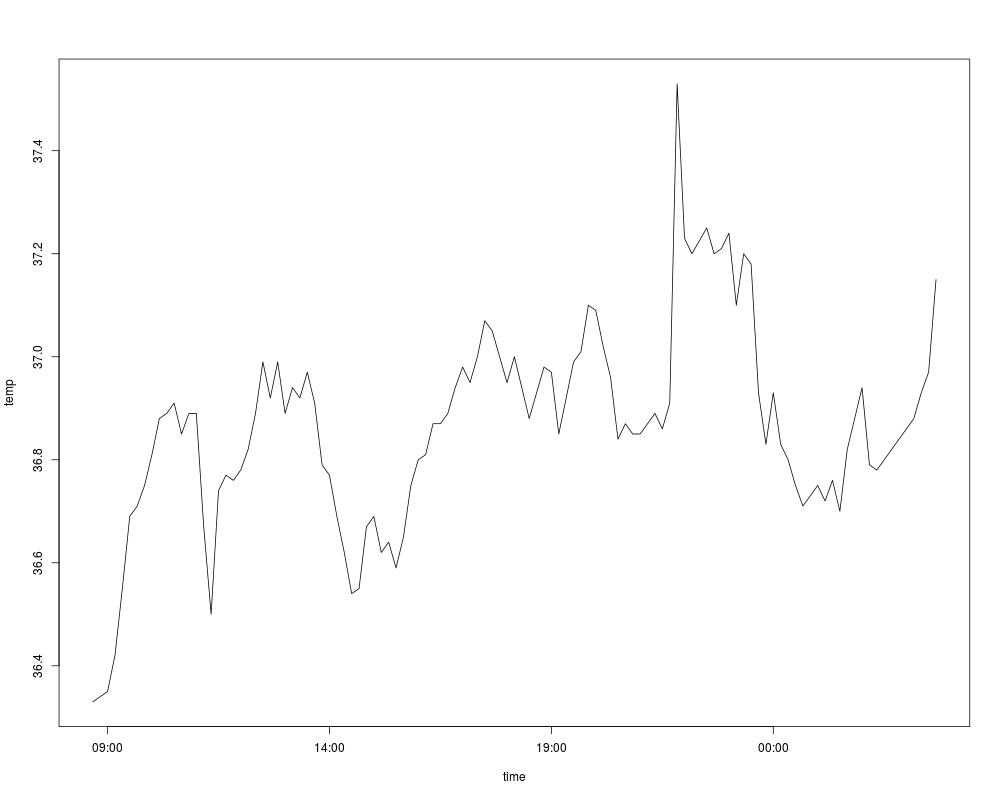
with(beaver1, {
time <- strptime(paste(1990, day, time %/% 100, time %% 100),
"%Y %j %H %M")
plot(time, temp, type = "l") # axis at 4-hour intervals.
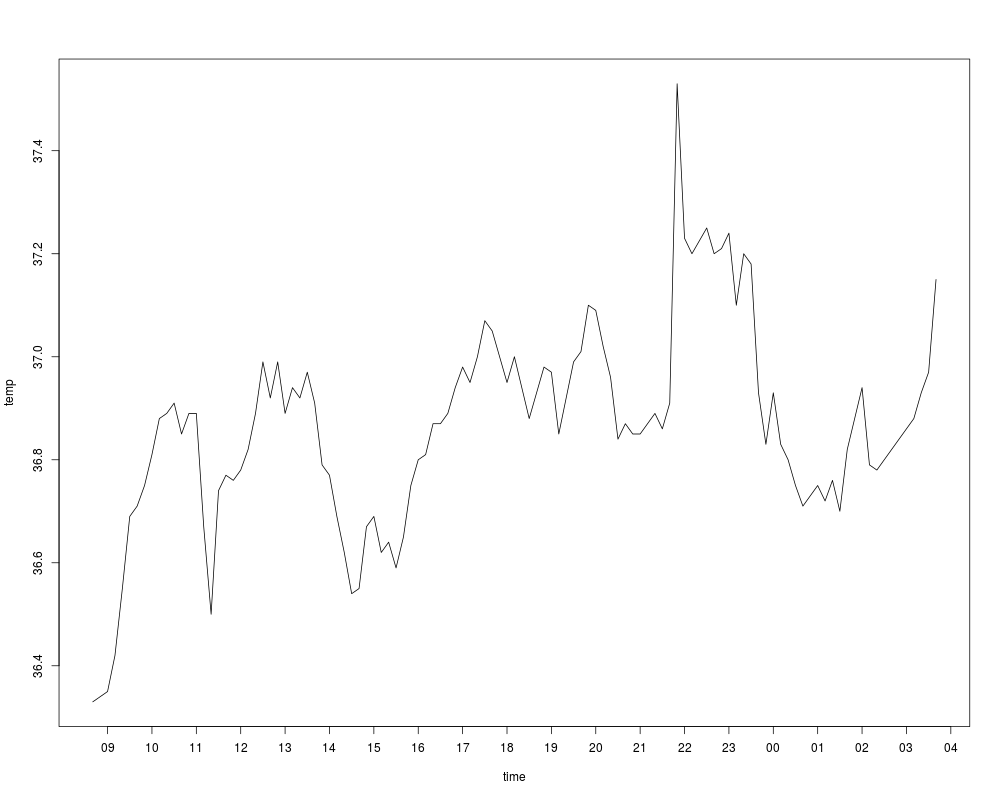
# now label every hour on the time axis
plot(time, temp, type = "l", xaxt = "n")
r <- as.POSIXct(round(range(time), "hours"))
axis.POSIXct(1, at = seq(r[1], r[2], by = "hour"), format = "%H")
})
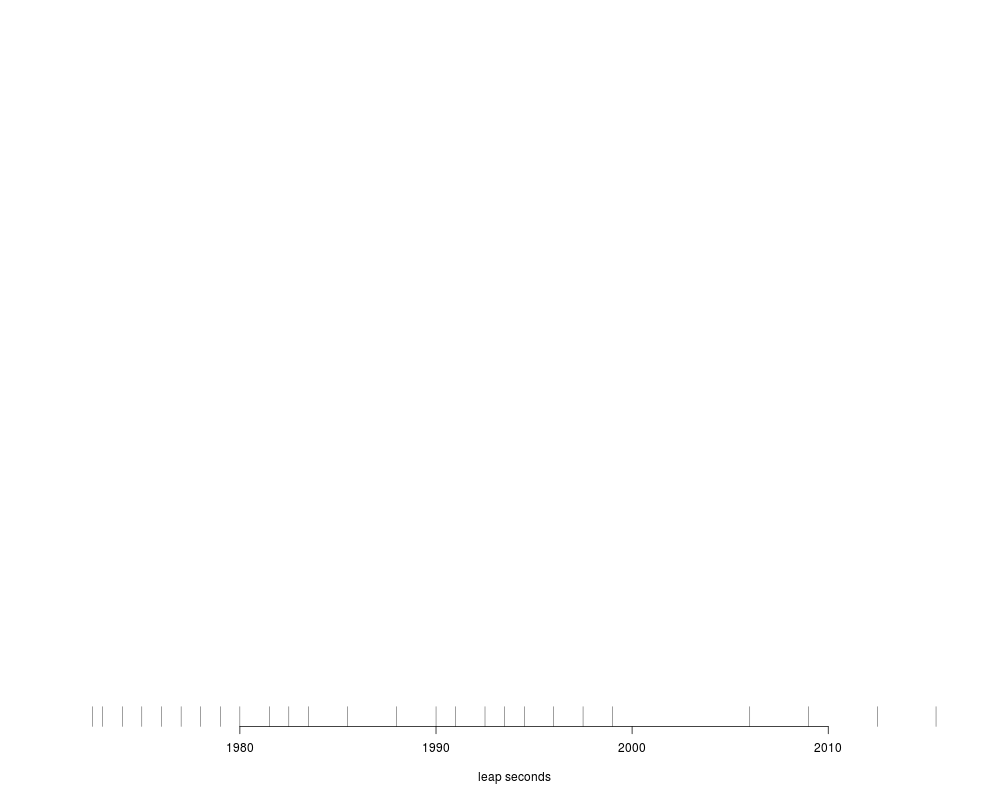
plot(.leap.seconds, seq_along(.leap.seconds), type = "n", yaxt = "n",
xlab = "leap seconds", ylab = "", bty = "n")
rug(.leap.seconds)
## or as dates
lps <- as.Date(.leap.seconds)
plot(lps, seq_along(.leap.seconds),
type = "n", yaxt = "n", xlab = "leap seconds",
ylab = "", bty = "n")
rug(lps)
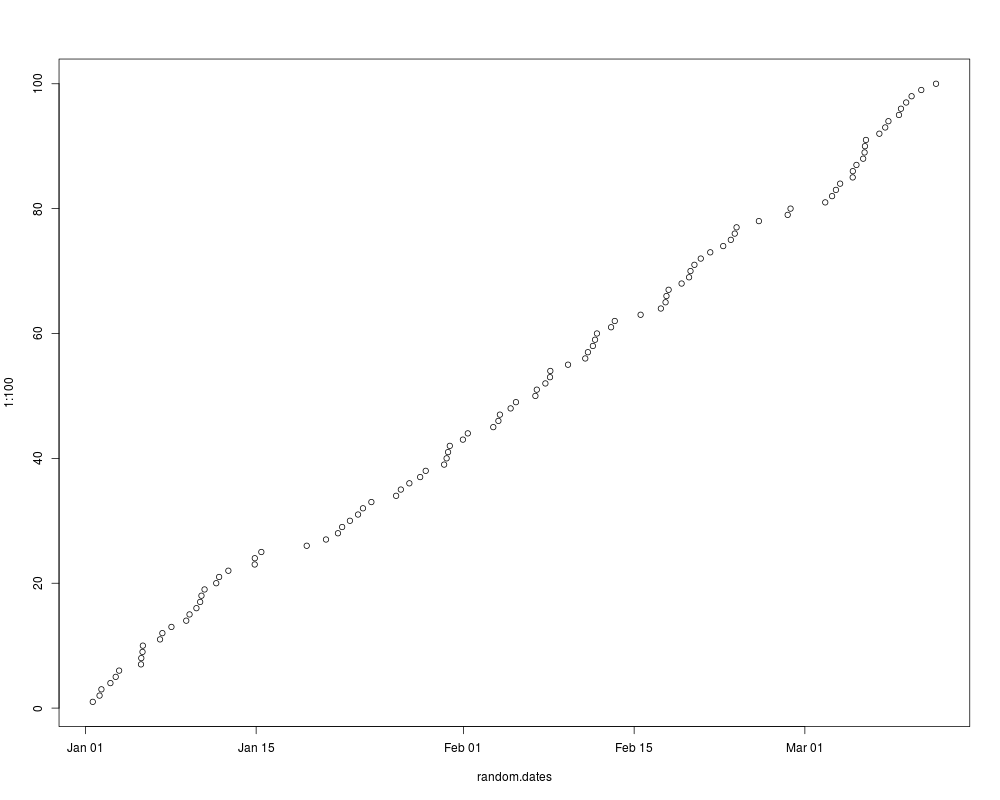
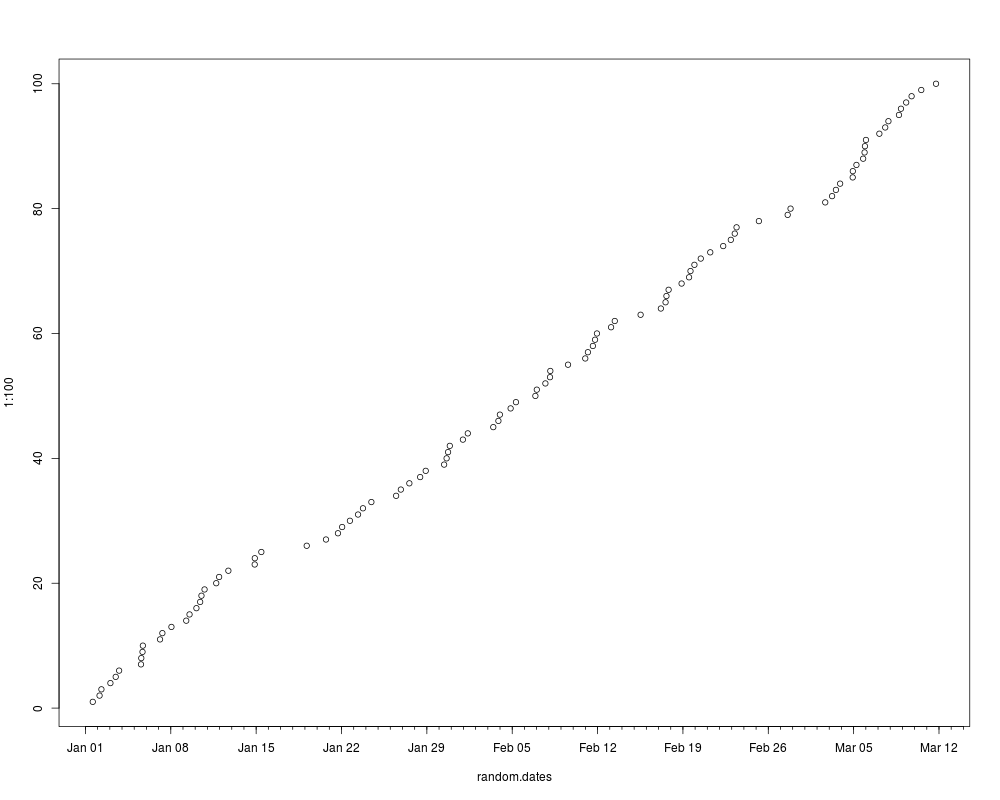
## 100 random dates in a 10-week period
random.dates <- as.Date("2001/1/1") + 70*sort(stats::runif(100))
plot(random.dates, 1:100)
# or for a better axis labelling
plot(random.dates, 1:100, xaxt = "n")
axis.Date(1, at = seq(as.Date("2001/1/1"), max(random.dates)+6, "weeks"))
axis.Date(1, at = seq(as.Date("2001/1/1"), max(random.dates)+6, "days"),
labels = FALSE, tcl = -0.2)
Results
R version 3.3.1 (2016-06-21) -- "Bug in Your Hair"
Copyright (C) 2016 The R Foundation for Statistical Computing
Platform: x86_64-pc-linux-gnu (64-bit)

R is free software and comes with ABSOLUTELY NO WARRANTY.
You are welcome to redistribute it under certain conditions.
Type 'license()' or 'licence()' for distribution details.

R is a collaborative project with many contributors.
Type 'contributors()' for more information and
'citation()' on how to cite R or R packages in publications.

Type 'demo()' for some demos, 'help()' for on-line help, or
'help.start()' for an HTML browser interface to help.
Type 'q()' to quit R.

> library(graphics)
> png(filename="/home/ddbj/snapshot/RGM3/R_rel/result/graphics/axis.POSIXct.Rd_%03d_medium.png", width=480, height=480)
> ### Name: axis.POSIXct
> ### Title: Date and Date-time Plotting Functions
> ### Aliases: axis.POSIXct axis.Date
> ### Keywords: utilities chron
>
> ### ** Examples
>
> with(beaver1, {
+ time <- strptime(paste(1990, day, time %/% 100, time %% 100),
+                  "%Y %j %H %M")
+ plot(time, temp, type = "l") # axis at 4-hour intervals.
+ # now label every hour on the time axis
+ plot(time, temp, type = "l", xaxt = "n")
+ r <- as.POSIXct(round(range(time), "hours"))
+ axis.POSIXct(1, at = seq(r[1], r[2], by = "hour"), format = "%H")
+ })
>
> plot(.leap.seconds, seq_along(.leap.seconds), type = "n", yaxt = "n",
+      xlab = "leap seconds", ylab = "", bty = "n")
> rug(.leap.seconds)
> ## or as dates
> lps <- as.Date(.leap.seconds)
> plot(lps, seq_along(.leap.seconds),
+      type = "n", yaxt = "n", xlab = "leap seconds",
+      ylab = "", bty = "n")
> rug(lps)
>
> ## 100 random dates in a 10-week period
> random.dates <- as.Date("2001/1/1") + 70*sort(stats::runif(100))
> plot(random.dates, 1:100)
> # or for a better axis labelling
> plot(random.dates, 1:100, xaxt = "n")
> axis.Date(1, at = seq(as.Date("2001/1/1"), max(random.dates)+6, "weeks"))
> axis.Date(1, at = seq(as.Date("2001/1/1"), max(random.dates)+6, "days"),
+      labels = FALSE, tcl = -0.2)
>
>
>
>
>
> dev.off()
null device
          1
>
|