Supported by Dr. Osamu Ogasawara and  . . |
|
Last data update: 2014.03.03 |
Add Grid to a PlotDescription
Usage
grid(nx = NULL, ny = nx, col = "lightgray", lty = "dotted",
     lwd = par("lwd"), equilogs = TRUE)
Arguments
NoteIf more fine tuning is required, use ReferencesMurrell, P. (2005) R Graphics. Chapman & Hall/CRC Press. See Also
Examples
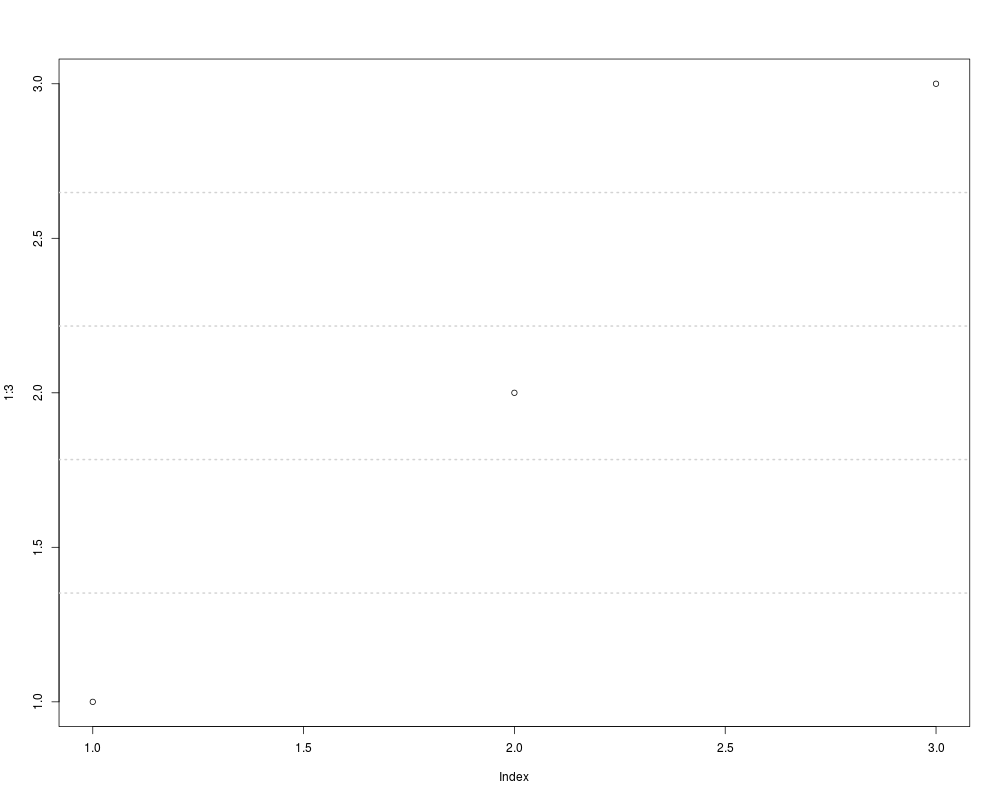
plot(1:3)
grid(NA, 5, lwd = 2) # grid only in y-direction
## maybe change the desired number of tick marks: par(lab = c(mx, my, 7))
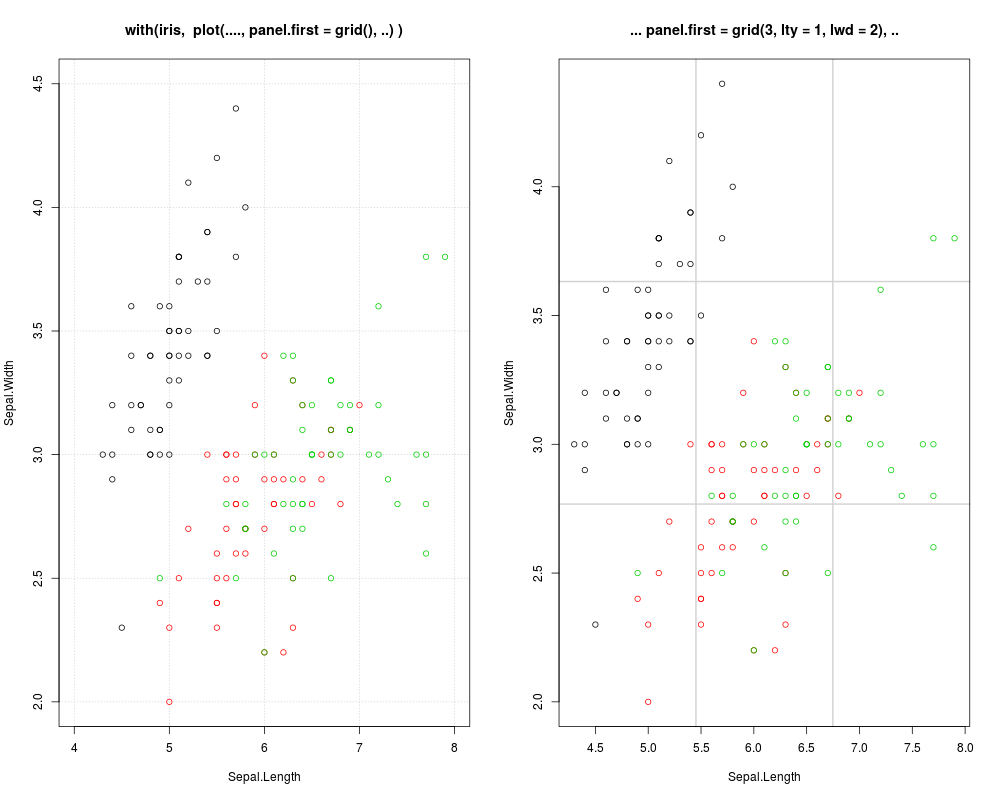
op <- par(mfcol = 1:2)
with(iris,
{
plot(Sepal.Length, Sepal.Width, col = as.integer(Species),
xlim = c(4, 8), ylim = c(2, 4.5), panel.first = grid(),
main = "with(iris, plot(...., panel.first = grid(), ..) )")
plot(Sepal.Length, Sepal.Width, col = as.integer(Species),
panel.first = grid(3, lty = 1, lwd = 2),
main = "... panel.first = grid(3, lty = 1, lwd = 2), ..")
}
)
par(op)
Results
R version 3.3.1 (2016-06-21) -- "Bug in Your Hair"
Copyright (C) 2016 The R Foundation for Statistical Computing
Platform: x86_64-pc-linux-gnu (64-bit)

R is free software and comes with ABSOLUTELY NO WARRANTY.
You are welcome to redistribute it under certain conditions.
Type 'license()' or 'licence()' for distribution details.

R is a collaborative project with many contributors.
Type 'contributors()' for more information and
'citation()' on how to cite R or R packages in publications.

Type 'demo()' for some demos, 'help()' for on-line help, or
'help.start()' for an HTML browser interface to help.
Type 'q()' to quit R.

> library(graphics)
> png(filename="/home/ddbj/snapshot/RGM3/R_rel/result/graphics/grid.Rd_%03d_medium.png", width=480, height=480)
> ### Name: grid
> ### Title: Add Grid to a Plot
> ### Aliases: grid
> ### Keywords: aplot
>
> ### ** Examples
>
> plot(1:3)
> grid(NA, 5, lwd = 2) # grid only in y-direction
>
> ## maybe change the desired number of tick marks:  par(lab = c(mx, my, 7))
> op <- par(mfcol = 1:2)
> with(iris,
+      {
+      plot(Sepal.Length, Sepal.Width, col = as.integer(Species),
+           xlim = c(4, 8), ylim = c(2, 4.5), panel.first = grid(),
+           main = "with(iris,  plot(...., panel.first = grid(), ..) )")
+      plot(Sepal.Length, Sepal.Width, col = as.integer(Species),
+           panel.first = grid(3, lty = 1, lwd = 2),
+           main = "... panel.first = grid(3, lty = 1, lwd = 2), ..")
+      }
+     )
> par(op)
>
>
>
>
>
>
> dev.off()
null device
          1
>
|