Supported by Dr. Osamu Ogasawara and  . . |
|
Last data update: 2014.03.03 |
Plot Methods for
|
x |
a |
y |
Must be |
type |
plotting type. |
ylim |
range of y-axis. |
lwd |
line width for bars when |
xlab, ylab |
x- and y-axis labels. |
frame.plot |
logical indicating if a frame ( |
... |
further graphical arguments, see |
See Also
plot.factor, the plot method for factors.
Examples
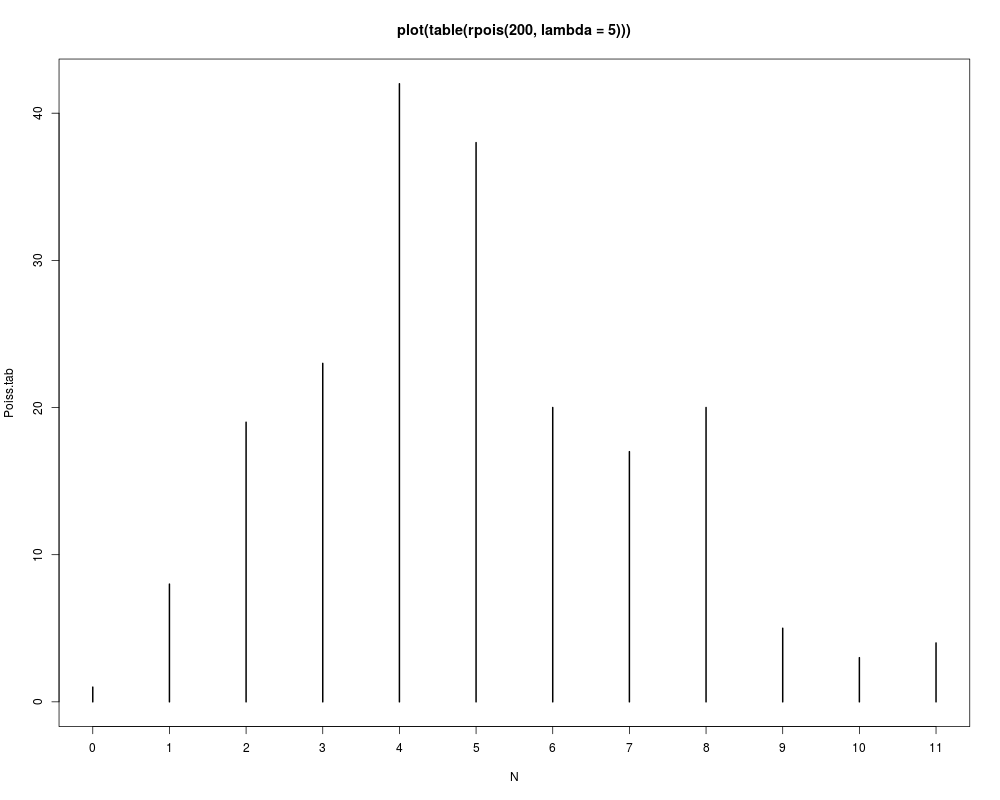
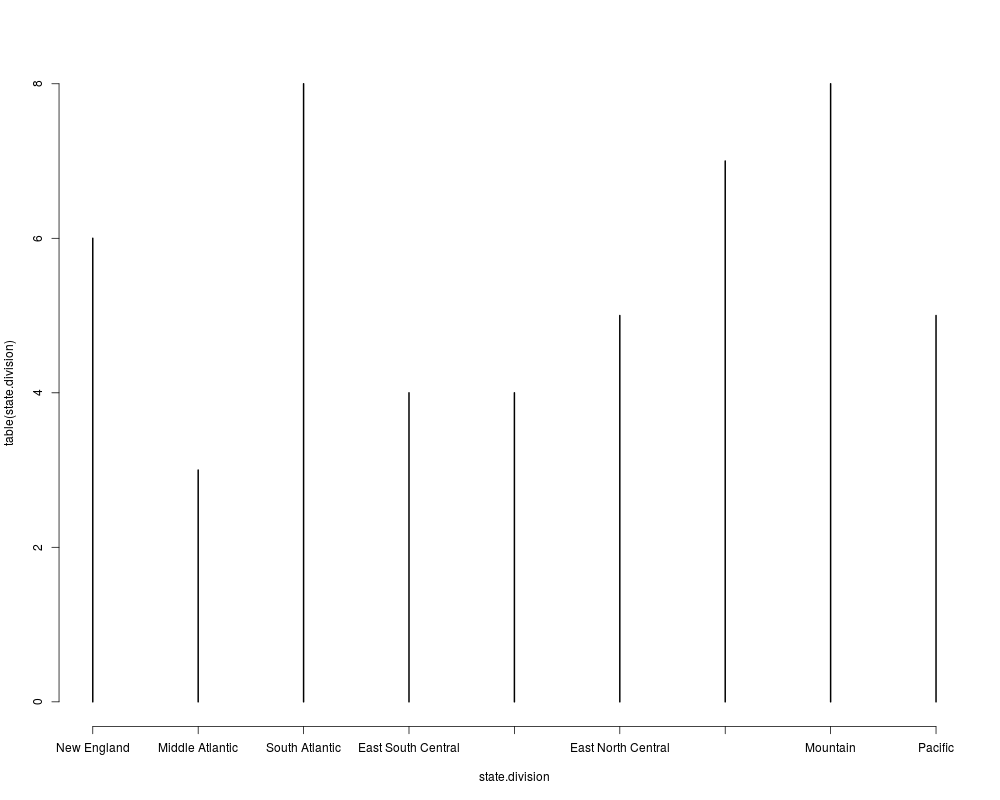
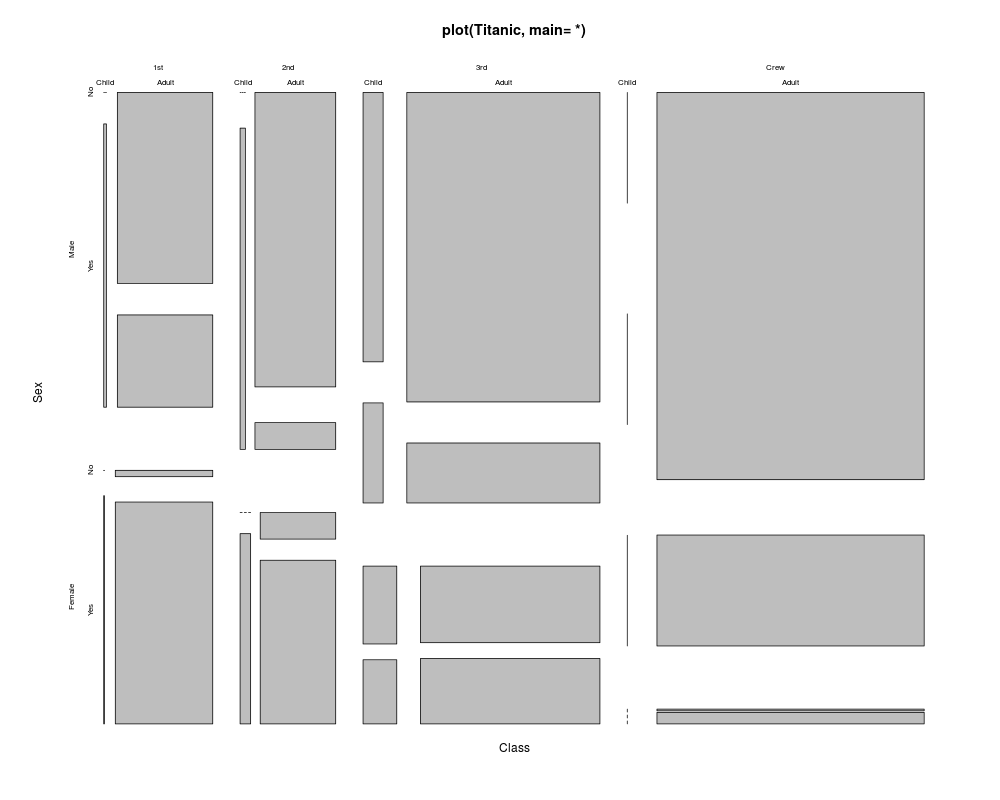
## 1-d tables
(Poiss.tab <- table(N = stats::rpois(200, lambda = 5)))
plot(Poiss.tab, main = "plot(table(rpois(200, lambda = 5)))")

plot(table(state.division))

## 4-D :
plot(Titanic, main ="plot(Titanic, main= *)")
Results
R version 3.3.1 (2016-06-21) -- "Bug in Your Hair"
Copyright (C) 2016 The R Foundation for Statistical Computing
Platform: x86_64-pc-linux-gnu (64-bit)

R is free software and comes with ABSOLUTELY NO WARRANTY.
You are welcome to redistribute it under certain conditions.
Type 'license()' or 'licence()' for distribution details.

R is a collaborative project with many contributors.
Type 'contributors()' for more information and
'citation()' on how to cite R or R packages in publications.

Type 'demo()' for some demos, 'help()' for on-line help, or
'help.start()' for an HTML browser interface to help.
Type 'q()' to quit R.

> library(graphics)
> png(filename="/home/ddbj/snapshot/RGM3/R_rel/result/graphics/plot.table.Rd_%03d_medium.png", width=480, height=480)
> ### Name: plot.table
> ### Title: Plot Methods for 'table' Objects
> ### Aliases: plot.table lines.table points.table
> ### Keywords: hplot category
>
> ### ** Examples
>
> ## 1-d tables
> (Poiss.tab <- table(N = stats::rpois(200, lambda = 5)))
N
 0  1  2  3  4  5  6  7  8  9 10 11 12 13
 1  4 19 25 26 45 27 30  8  7  3  3  1  1
> plot(Poiss.tab, main = "plot(table(rpois(200, lambda = 5)))")
>
> plot(table(state.division))
>
> ## 4-D :
> plot(Titanic, main ="plot(Titanic, main= *)")
>
>
>
>
>
>
> dev.off()
null device
          1
>
|
Created & Maintained by Osamu Ogasawara (osamu.ogasawara@gmail.com) and 