Supported by Dr. Osamu Ogasawara and  . . |
|
Last data update: 2014.03.03 |
Add Points to a PlotDescription
Usagepoints(x, ...) ## Default S3 method: points(x, y = NULL, type = "p", ...) Arguments
DetailsThe coordinates can be passed in a plotting structure
(a list with Graphical parameters commonly used are
Others less commonly used are The graphical parameters Points whose 'pch' valuesValues of
Note that unlike S (which uses octagons), symbols
The following R plotting symbols are can be obtained with
Note that all of these both fill the shape and draw a border. Some
care in interpretation is needed when semi-transparent colours are
used for both fill and border (and the result might be device-specific
and even viewer-specific for The difference between Values A character string consisting of a single character is converted to an
integer: If If If the symbol font ( NoteA single-byte encoding may include the characters in
Not all negative numbers are valid as Unicode code points, and no check is done. A display device is likely to use a rectangle for (or omit) Unicode code points which are invalid or for which it does not have a glyph in the font used. What happens for very small or zero values of ReferencesBecker, R. A., Chambers, J. M. and Wilks, A. R. (1988) The New S Language. Wadsworth & Brooks/Cole. See Also
Examples
require(stats) # for rnorm
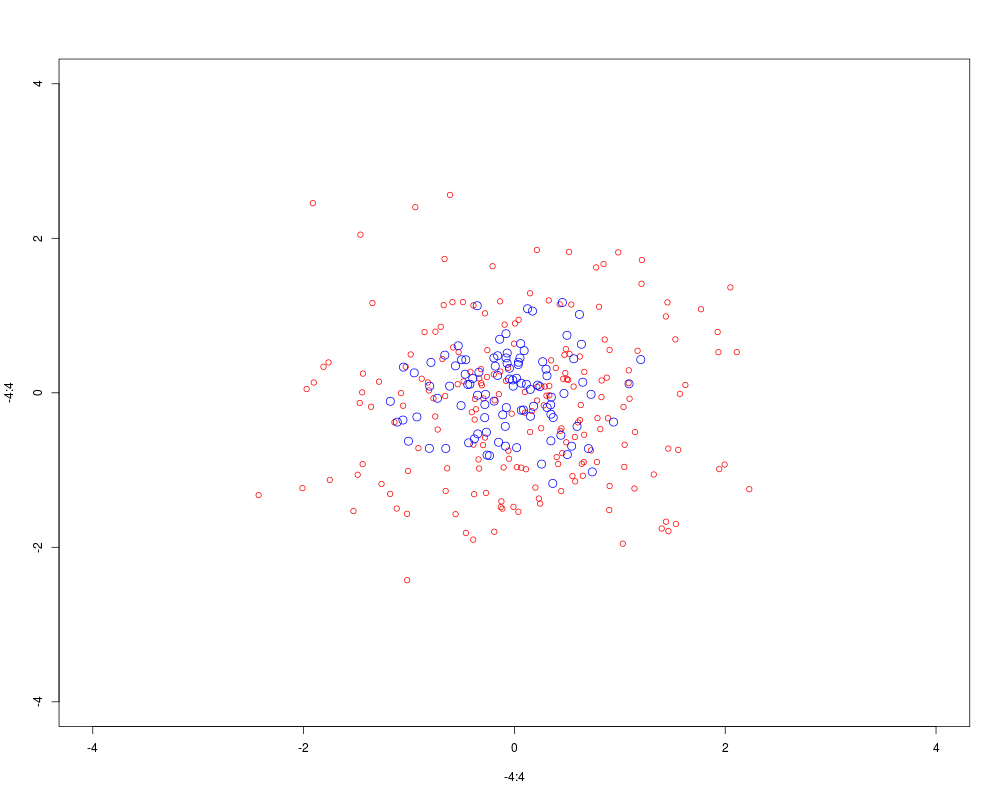
plot(-4:4, -4:4, type = "n") # setting up coord. system
points(rnorm(200), rnorm(200), col = "red")
points(rnorm(100)/2, rnorm(100)/2, col = "blue", cex = 1.5)
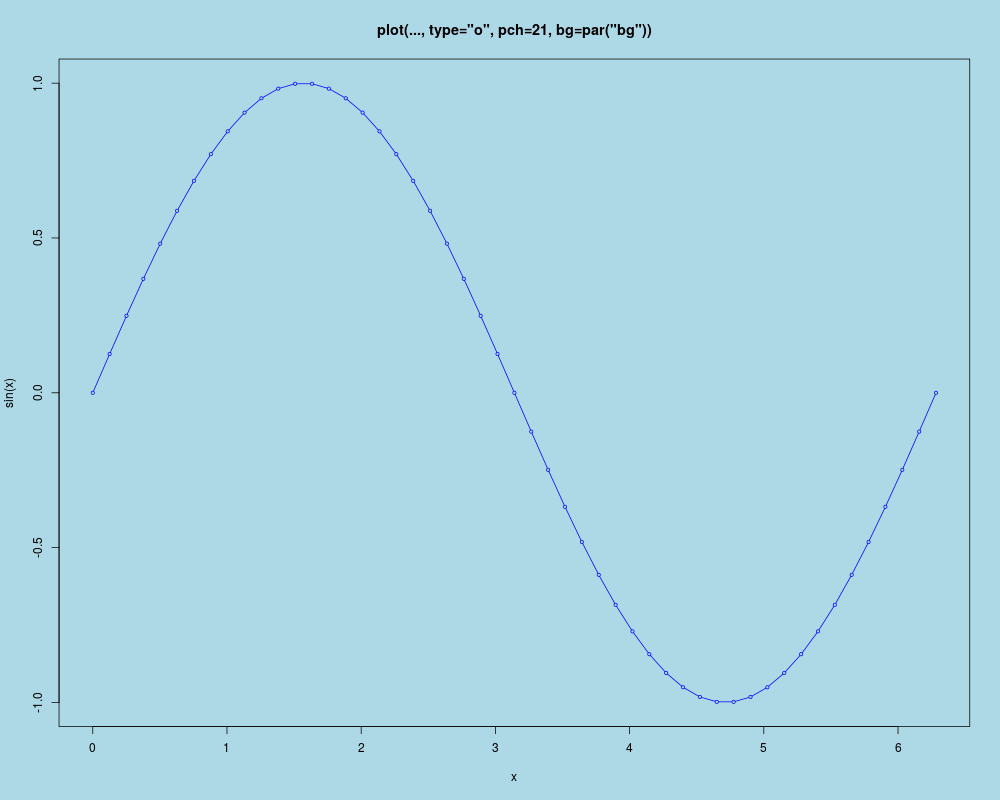
op <- par(bg = "light blue")
x <- seq(0, 2*pi, len = 51)
## something "between type='b' and type='o'":
plot(x, sin(x), type = "o", pch = 21, bg = par("bg"), col = "blue", cex = .6,
main = 'plot(..., type="o", pch=21, bg=par("bg"))')
par(op)
## Not run:
## The figure was produced by calls like
png("pch.png", height = 0.7, width = 7, res = 100, units = "in")
par(mar = rep(0,4))
plot(c(-1, 26), 0:1, type = "n", axes = FALSE)
text(0:25, 0.6, 0:25, cex = 0.5)
points(0:25, rep(0.3, 26), pch = 0:25, bg = "grey")
## End(Not run)
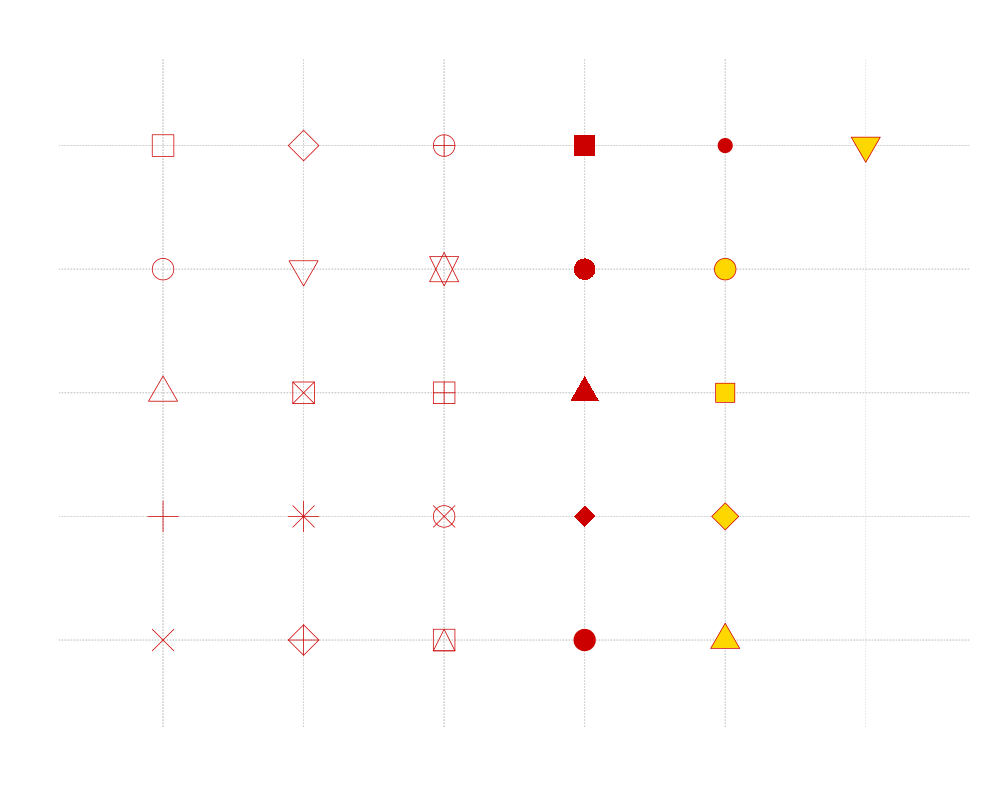
##-------- Showing all the extra & some char graphics symbols ---------
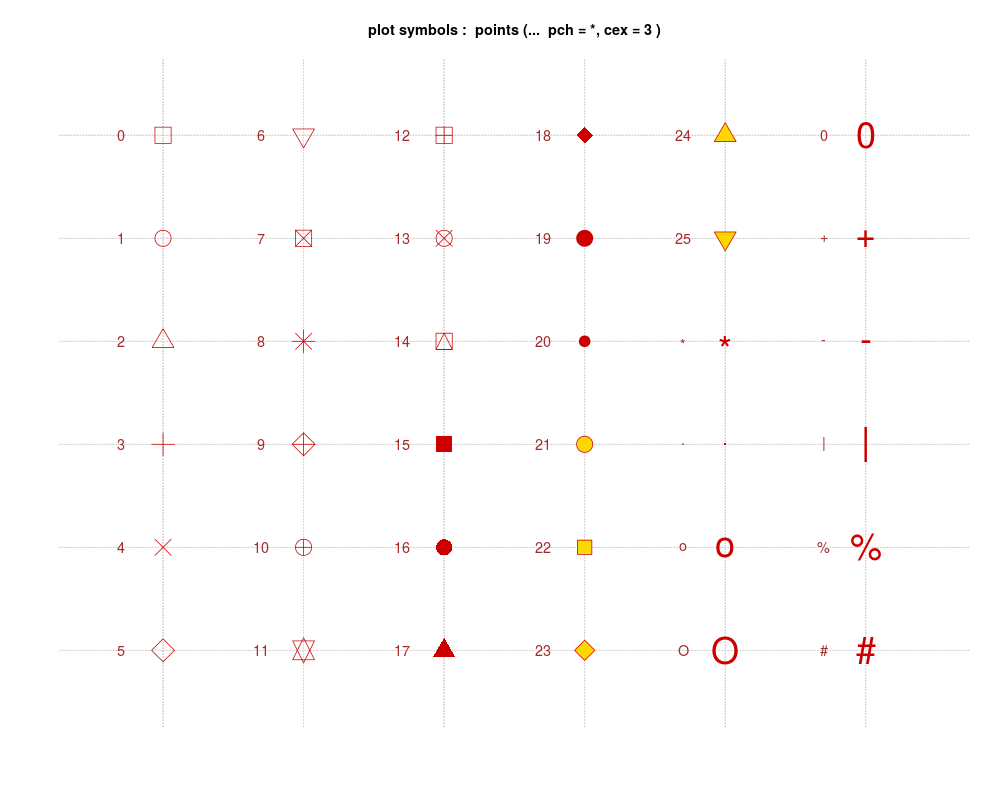
pchShow <-
function(extras = c("*",".", "o","O","0","+","-","|","%","#"),
cex = 3, ## good for both .Device=="postscript" and "x11"
col = "red3", bg = "gold", coltext = "brown", cextext = 1.2,
main = paste("plot symbols : points (... pch = *, cex =",
cex,")"))
{
nex <- length(extras)
np <- 26 + nex
ipch <- 0:(np-1)
k <- floor(sqrt(np))
dd <- c(-1,1)/2
rx <- dd + range(ix <- ipch %/% k)
ry <- dd + range(iy <- 3 + (k-1)- ipch %% k)
pch <- as.list(ipch) # list with integers & strings
if(nex > 0) pch[26+ 1:nex] <- as.list(extras)
plot(rx, ry, type = "n", axes = FALSE, xlab = "", ylab = "", main = main)
abline(v = ix, h = iy, col = "lightgray", lty = "dotted")
for(i in 1:np) {
pc <- pch[[i]]
## 'col' symbols with a 'bg'-colored interior (where available) :
points(ix[i], iy[i], pch = pc, col = col, bg = bg, cex = cex)
if(cextext > 0)
text(ix[i] - 0.3, iy[i], pc, col = coltext, cex = cextext)
}
}
pchShow()
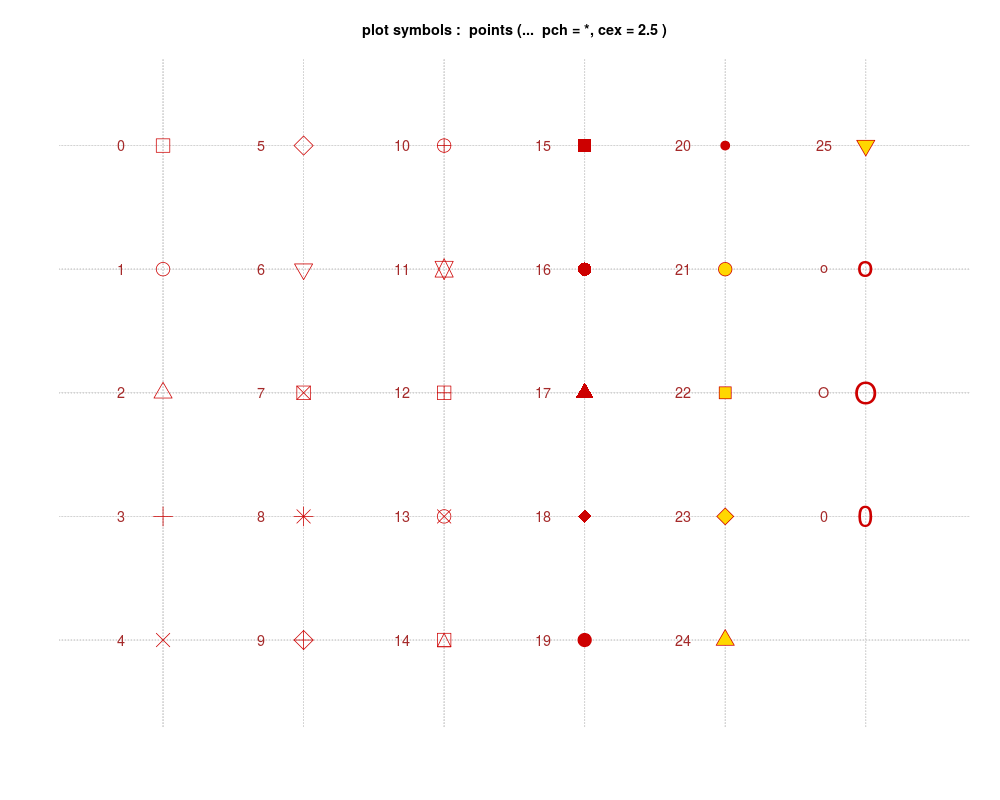
pchShow(c("o","O","0"), cex = 2.5)
pchShow(NULL, cex = 4, cextext = 0, main = NULL)
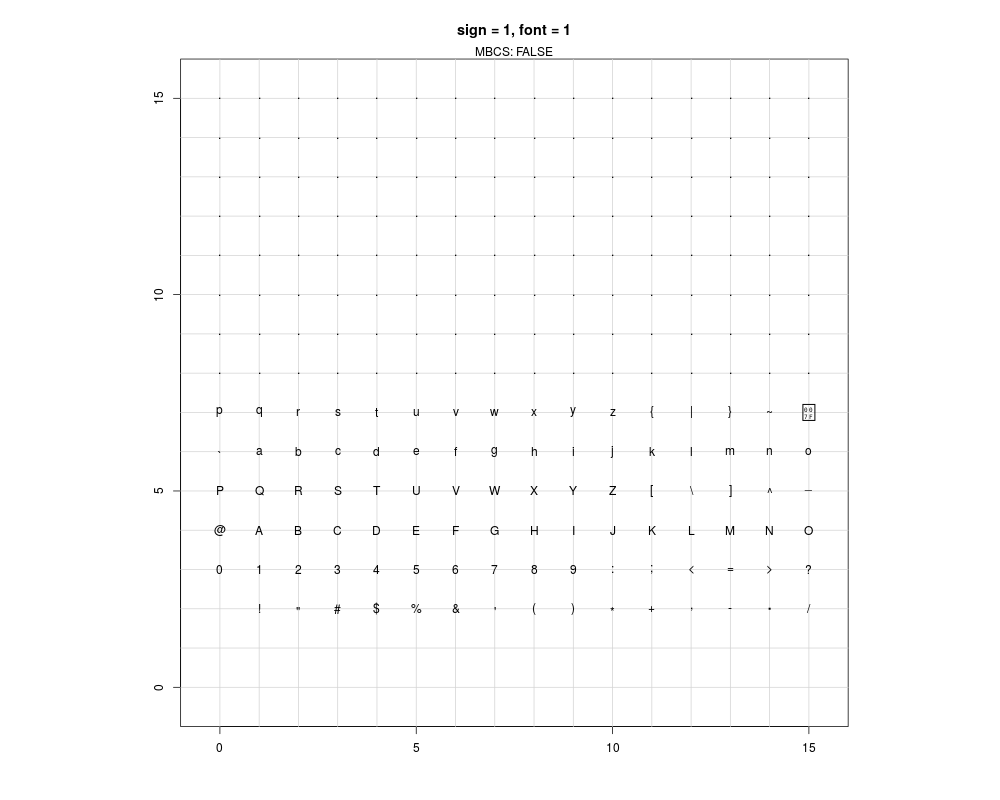
## ------------ test code for various pch specifications -------------
# Try this in various font families (including Hershey)
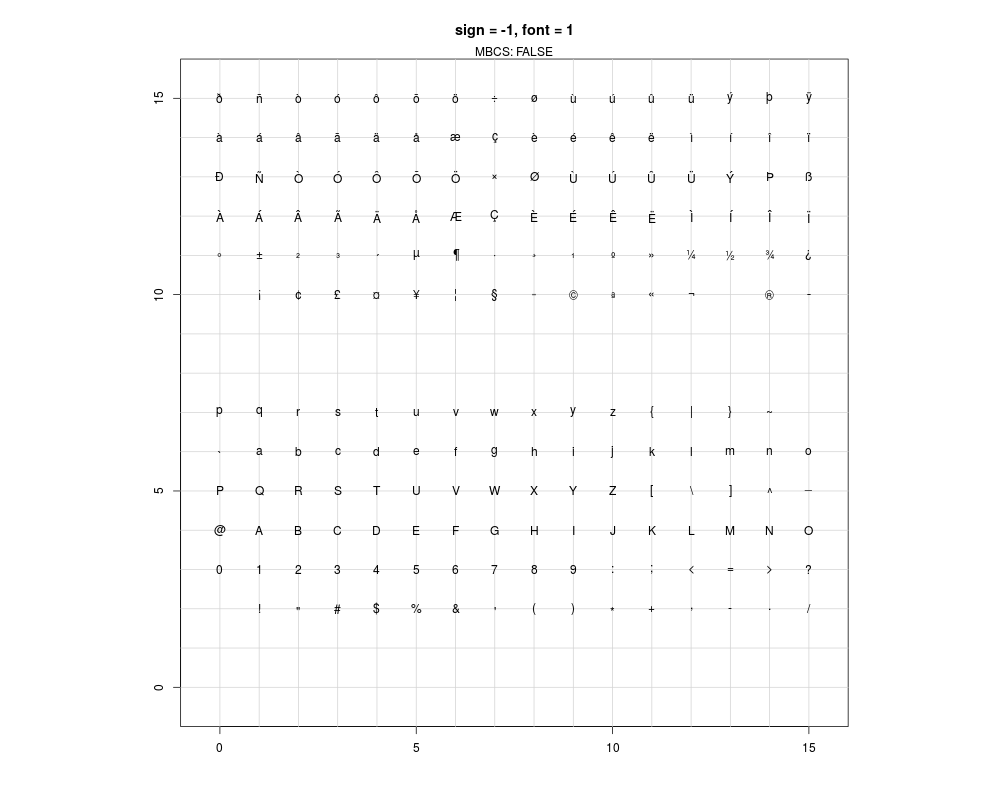
# and locales. Use sign = -1 asserts we want Latin-1.
# Standard cases in a MBCS locale will not plot the top half.
TestChars <- function(sign = 1, font = 1, ...)
{
MB <- l10n_info()$MBCS
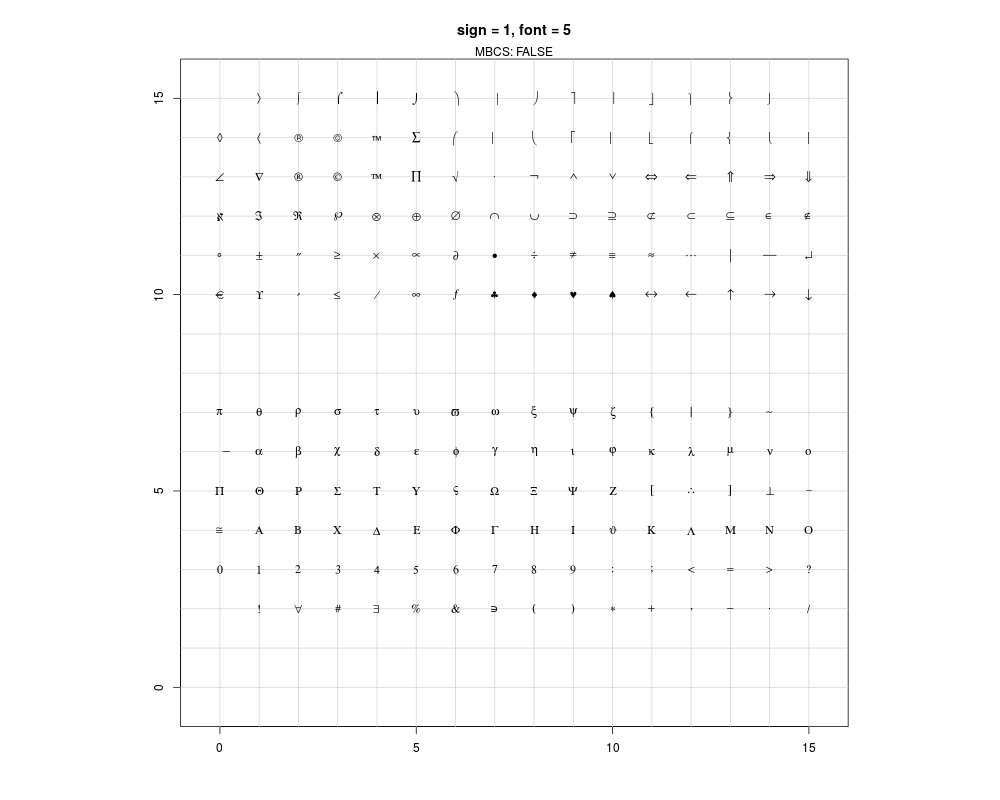
r <- if(font == 5) { sign <- 1; c(32:126, 160:254)
} else if(MB) 32:126 else 32:255
if (sign == -1) r <- c(32:126, 160:255)
par(pty = "s")
plot(c(-1,16), c(-1,16), type = "n", xlab = "", ylab = "",
xaxs = "i", yaxs = "i",
main = sprintf("sign = %d, font = %d", sign, font))
grid(17, 17, lty = 1) ; mtext(paste("MBCS:", MB))
for(i in r) try(points(i%%16, i%/%16, pch = sign*i, font = font,...))
}
TestChars()
try(TestChars(sign = -1))
TestChars(font = 5) # Euro might be at 160 (0+10*16).
# Mac OS has apple at 240 (0+15*16).
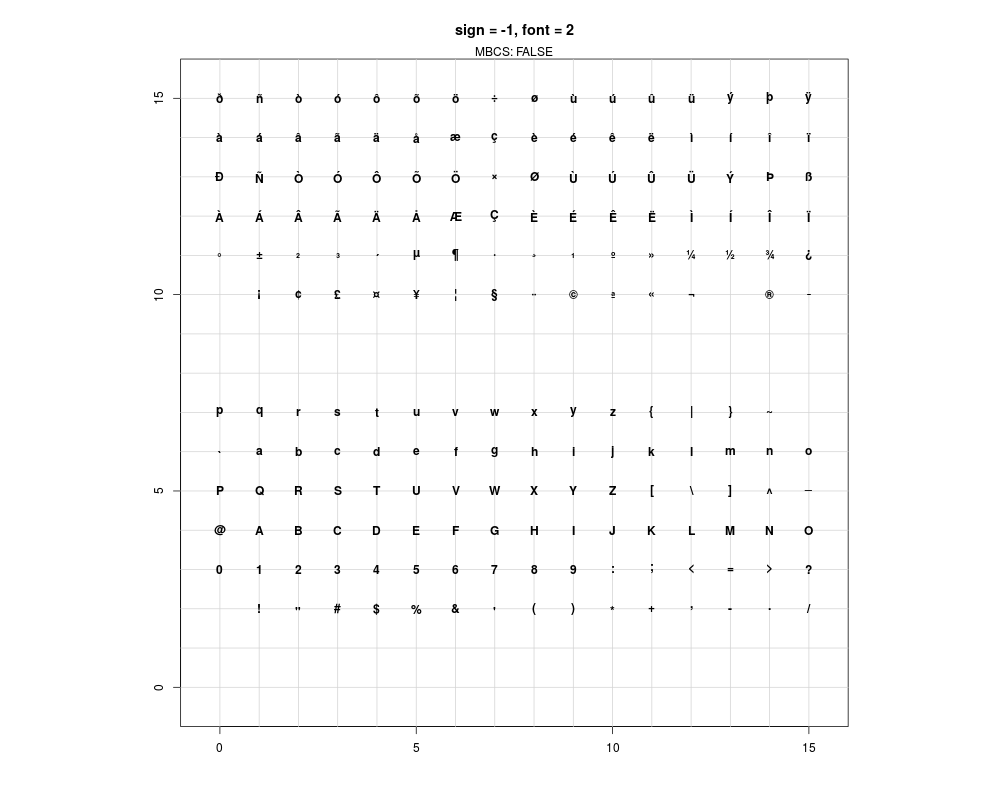
try(TestChars(-1, font = 2)) # bold
Results
R version 3.3.1 (2016-06-21) -- "Bug in Your Hair"
Copyright (C) 2016 The R Foundation for Statistical Computing
Platform: x86_64-pc-linux-gnu (64-bit)

R is free software and comes with ABSOLUTELY NO WARRANTY.
You are welcome to redistribute it under certain conditions.
Type 'license()' or 'licence()' for distribution details.

R is a collaborative project with many contributors.
Type 'contributors()' for more information and
'citation()' on how to cite R or R packages in publications.

Type 'demo()' for some demos, 'help()' for on-line help, or
'help.start()' for an HTML browser interface to help.
Type 'q()' to quit R.

> library(graphics)
> png(filename="/home/ddbj/snapshot/RGM3/R_rel/result/graphics/points.Rd_%03d_medium.png", width=480, height=480)
> ### Name: points
> ### Title: Add Points to a Plot
> ### Aliases: points points.default pch
> ### Keywords: aplot
>
> ### ** Examples
>
> require(stats) # for rnorm
> plot(-4:4, -4:4, type = "n")  # setting up coord. system
> points(rnorm(200), rnorm(200), col = "red")
> points(rnorm(100)/2, rnorm(100)/2, col = "blue", cex = 1.5)
>
> op <- par(bg = "light blue")
> x <- seq(0, 2*pi, len = 51)
> ## something "between type='b' and type='o'":
> plot(x, sin(x), type = "o", pch = 21, bg = par("bg"), col = "blue", cex = .6,
+  main = 'plot(..., type="o", pch=21, bg=par("bg"))')
> par(op)
>
> ## Not run:
> ##D ## The figure was produced by calls like
> ##D png("pch.png", height = 0.7, width = 7, res = 100, units = "in")
> ##D par(mar = rep(0,4))
> ##D plot(c(-1, 26), 0:1, type = "n", axes = FALSE)
> ##D text(0:25, 0.6, 0:25, cex = 0.5)
> ##D points(0:25, rep(0.3, 26), pch = 0:25, bg = "grey")
> ## End(Not run)
>
> ##-------- Showing all the extra & some char graphics symbols ---------
> pchShow <-
+   function(extras = c("*",".", "o","O","0","+","-","|","%","#"),
+            cex = 3, ## good for both .Device=="postscript" and "x11"
+            col = "red3", bg = "gold", coltext = "brown", cextext = 1.2,
+            main = paste("plot symbols :  points (...  pch = *, cex =",
+                         cex,")"))
+   {
+     nex <- length(extras)
+     np  <- 26 + nex
+     ipch <- 0:(np-1)
+     k <- floor(sqrt(np))
+     dd <- c(-1,1)/2
+     rx <- dd + range(ix <- ipch %/% k)
+     ry <- dd + range(iy <- 3 + (k-1)- ipch %% k)
+     pch <- as.list(ipch) # list with integers & strings
+     if(nex > 0) pch[26+ 1:nex] <- as.list(extras)
+     plot(rx, ry, type = "n", axes  =  FALSE, xlab = "", ylab = "", main = main)
+     abline(v = ix, h = iy, col = "lightgray", lty = "dotted")
+     for(i in 1:np) {
+       pc <- pch[[i]]
+       ## 'col' symbols with a 'bg'-colored interior (where available) :
+       points(ix[i], iy[i], pch = pc, col = col, bg = bg, cex = cex)
+       if(cextext > 0)
+           text(ix[i] - 0.3, iy[i], pc, col = coltext, cex = cextext)
+     }
+   }
>
> pchShow()
> pchShow(c("o","O","0"), cex = 2.5)
> pchShow(NULL, cex = 4, cextext = 0, main = NULL)
>
> ## No test:
> ## ------------ test code for various pch specifications -------------
> # Try this in various font families (including Hershey)
> # and locales.  Use sign = -1 asserts we want Latin-1.
> # Standard cases in a MBCS locale will not plot the top half.
> TestChars <- function(sign = 1, font = 1, ...)
+ {
+    MB <- l10n_info()$MBCS
+    r <- if(font == 5) { sign <- 1; c(32:126, 160:254)
+        } else if(MB) 32:126 else 32:255
+    if (sign == -1) r <- c(32:126, 160:255)
+    par(pty = "s")
+    plot(c(-1,16), c(-1,16), type = "n", xlab = "", ylab = "",
+         xaxs = "i", yaxs = "i",
+         main = sprintf("sign = %d, font = %d", sign, font))
+    grid(17, 17, lty = 1) ; mtext(paste("MBCS:", MB))
+    for(i in r) try(points(i%%16, i%/%16, pch = sign*i, font = font,...))
+ }
> TestChars()
> try(TestChars(sign = -1))
> TestChars(font = 5)  # Euro might be at 160 (0+10*16).
>                      # Mac OS has apple at 240 (0+15*16).
> try(TestChars(-1, font = 2))  # bold
> ## End(No test)
>
>
>
>
> dev.off()
null device
          1
>
|