Supported by Dr. Osamu Ogasawara and  . . |
|
Last data update: 2014.03.03 |
Creating and Controlling Multiple Screens on a Single DeviceDescription
Usagesplit.screen(figs, screen, erase = TRUE) screen(n = , new = TRUE) erase.screen(n = ) close.screen(n, all.screens = FALSE) Arguments
DetailsThe first call to If the current screen is closed, Value
WarningsThe recommended way to use these functions is to completely draw a plot and all additions (i.e., points and lines) to the base plot, prior to selecting and plotting on another screen. The behavior associated with returning to a screen to add to an existing plot is unpredictable and may result in problems that are not readily visible. These functions are totally incompatible with the other mechanisms for
arranging plots on a device: The functions are also incompatible with some plotting functions,
such as
ReferencesChambers, J. M. and Hastie, T. J. (1992) Statistical Models in S. Wadsworth & Brooks/Cole. Murrell, P. (2005) R Graphics. Chapman & Hall/CRC Press. See Also
Examples
if (interactive()) {
par(bg = "white") # default is likely to be transparent
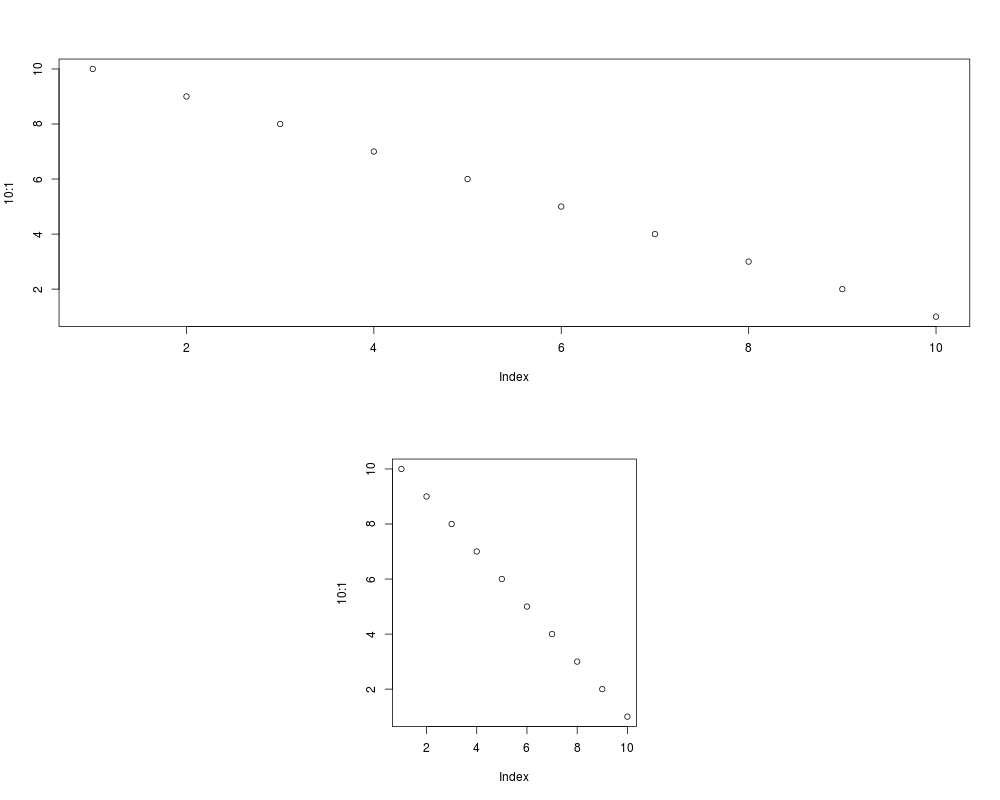
split.screen(c(2, 1)) # split display into two screens
split.screen(c(1, 3), screen = 2) # now split the bottom half into 3
screen(1) # prepare screen 1 for output
plot(10:1)
screen(4) # prepare screen 4 for output
plot(10:1)
close.screen(all = TRUE) # exit split-screen mode
split.screen(c(2, 1)) # split display into two screens
split.screen(c(1, 2), 2) # split bottom half in two
plot(1:10) # screen 3 is active, draw plot
erase.screen() # forgot label, erase and redraw
plot(1:10, ylab = "ylab 3")
screen(1) # prepare screen 1 for output
plot(1:10)
screen(4) # prepare screen 4 for output
plot(1:10, ylab = "ylab 4")
screen(1, FALSE) # return to screen 1, but do not clear
plot(10:1, axes = FALSE, lty = 2, ylab = "") # overlay second plot
axis(4) # add tic marks to right-hand axis
title("Plot 1")
close.screen(all = TRUE) # exit split-screen mode
}
Results
R version 3.3.1 (2016-06-21) -- "Bug in Your Hair"
Copyright (C) 2016 The R Foundation for Statistical Computing
Platform: x86_64-pc-linux-gnu (64-bit)

R is free software and comes with ABSOLUTELY NO WARRANTY.
You are welcome to redistribute it under certain conditions.
Type 'license()' or 'licence()' for distribution details.

R is a collaborative project with many contributors.
Type 'contributors()' for more information and
'citation()' on how to cite R or R packages in publications.

Type 'demo()' for some demos, 'help()' for on-line help, or
'help.start()' for an HTML browser interface to help.
Type 'q()' to quit R.

> library(graphics)
> png(filename="/home/ddbj/snapshot/RGM3/R_rel/result/graphics/screen.Rd_%03d_medium.png", width=480, height=480)
> ### Name: screen
> ### Title: Creating and Controlling Multiple Screens on a Single Device
> ### Aliases: screen split.screen erase.screen close.screen
> ### Keywords: aplot dplot device
>
> ### ** Examples
>
> #if (interactive()) {
> par(bg = "white")           # default is likely to be transparent
> split.screen(c(2, 1))       # split display into two screens
[1] 1 2
> split.screen(c(1, 3), screen = 2) # now split the bottom half into 3
[1] 3 4 5
> screen(1) # prepare screen 1 for output
> plot(10:1)
> screen(4) # prepare screen 4 for output
> plot(10:1)
> close.screen(all = TRUE)    # exit split-screen mode
>
> split.screen(c(2, 1))       # split display into two screens
[1] 1 2
> split.screen(c(1, 2), 2)    # split bottom half in two
[1] 3 4
> plot(1:10)                  # screen 3 is active, draw plot
> erase.screen()              # forgot label, erase and redraw
> plot(1:10, ylab = "ylab 3")
> screen(1)                   # prepare screen 1 for output
> plot(1:10)
> screen(4)                   # prepare screen 4 for output
> plot(1:10, ylab = "ylab 4")
> screen(1, FALSE)            # return to screen 1, but do not clear
> plot(10:1, axes = FALSE, lty = 2, ylab = "")  # overlay second plot
> axis(4)                     # add tic marks to right-hand axis
> title("Plot 1")
> close.screen(all = TRUE)    # exit split-screen mode
> #}
>
>
>
>
>
> dev.off()
null device
          1
>
|