Supported by Dr. Osamu Ogasawara and  . . |
|
Last data update: 2014.03.03 |
Produce a Sunflower Scatter PlotDescriptionMultiple points are plotted as ‘sunflowers’ with multiple leaves (‘petals’) such that overplotting is visualized instead of accidental and invisible. Usage
sunflowerplot(x, ...)

## Default S3 method:
sunflowerplot(x, y = NULL, number, log = "", digits = 6,
              xlab = NULL, ylab = NULL, xlim = NULL, ylim = NULL,
              add = FALSE, rotate = FALSE,
              pch = 16, cex = 0.8, cex.fact = 1.5,
              col = par("col"), bg = NA, size = 1/8, seg.col = 2,
              seg.lwd = 1.5, ...)

## S3 method for class 'formula'
sunflowerplot(formula, data = NULL, xlab = NULL, ylab = NULL, ...,
             subset, na.action = NULL)
Arguments
DetailsThis is a generic function with default and formula methods. For If ValueA list with three components of same length,
Use Side EffectsA scatter plot is drawn with ‘sunflowers’ as symbols. Author(s)Andreas Ruckstuhl, Werner Stahel, Martin Maechler, Tim Hesterberg, 1989–1993. Port to R by Martin Maechler maechler@stat.math.ethz.ch. ReferencesChambers, J. M., Cleveland, W. S., Kleiner, B. and Tukey, P. A. (1983) Graphical Methods for Data Analysis. Wadsworth. Schilling, M. F. and Watkins, A. E. (1994) A suggestion for sunflower plots. The American Statistician, 48, 303–305. Murrell, P. (2005) R Graphics. Chapman & Hall/CRC Press. See Also
Examples
require(stats) # for rnorm
require(grDevices)
## 'number' is computed automatically:
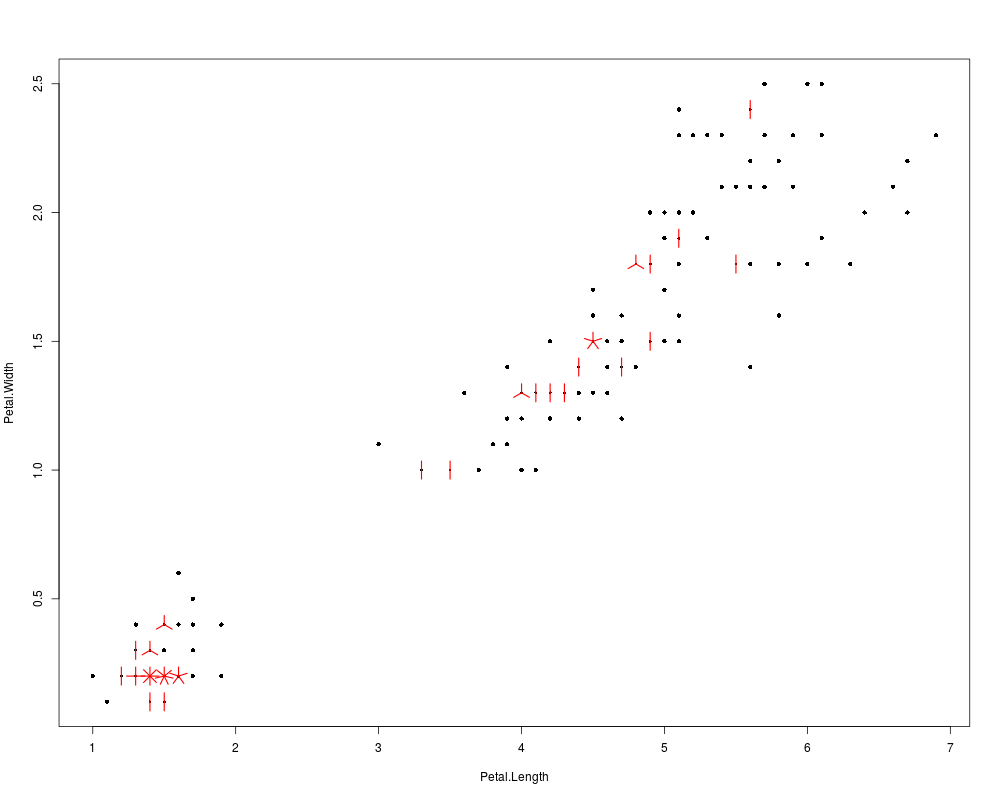
sunflowerplot(iris[, 3:4])
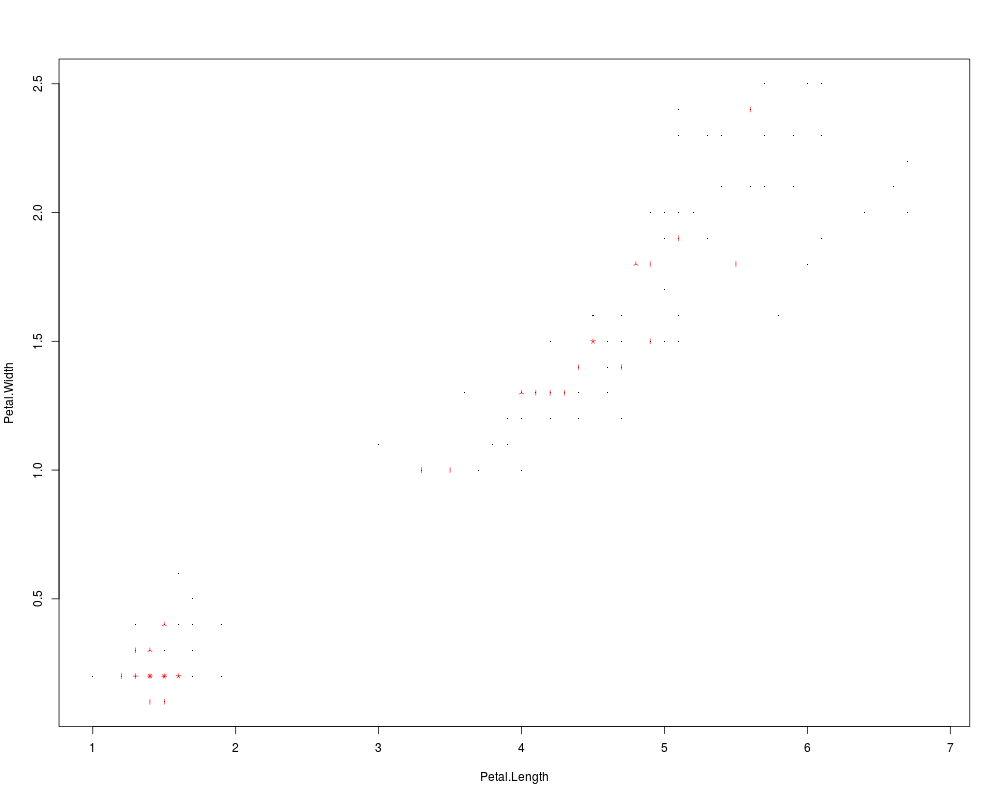
## Imitating Chambers et al, p.109, closely:
sunflowerplot(iris[, 3:4], cex = .2, cex.fact = 1, size = .035, seg.lwd = .8)
## or
sunflowerplot(Petal.Width ~ Petal.Length, data = iris,
cex = .2, cex.fact = 1, size = .035, seg.lwd = .8)
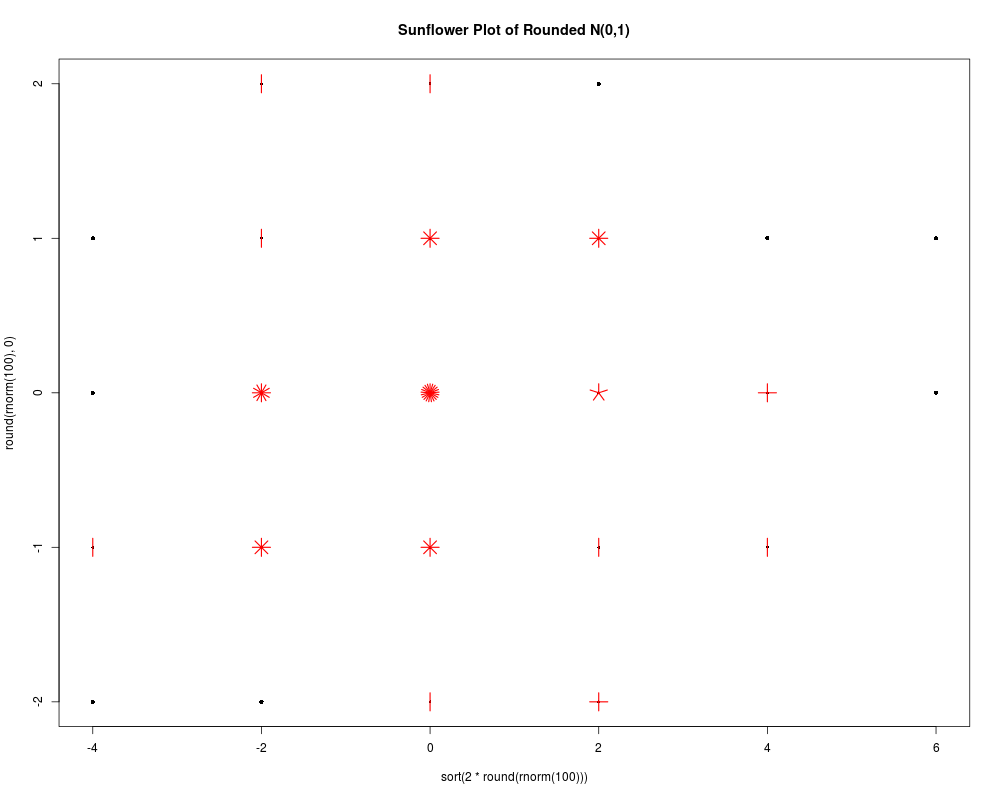
sunflowerplot(x = sort(2*round(rnorm(100))), y = round(rnorm(100), 0),
main = "Sunflower Plot of Rounded N(0,1)")
## Similarly using a "xyTable" argument:
xyT <- xyTable(x = sort(2*round(rnorm(100))), y = round(rnorm(100), 0),
digits = 3)
utils::str(xyT, vec.len = 20)
sunflowerplot(xyT, main = "2nd Sunflower Plot of Rounded N(0,1)")
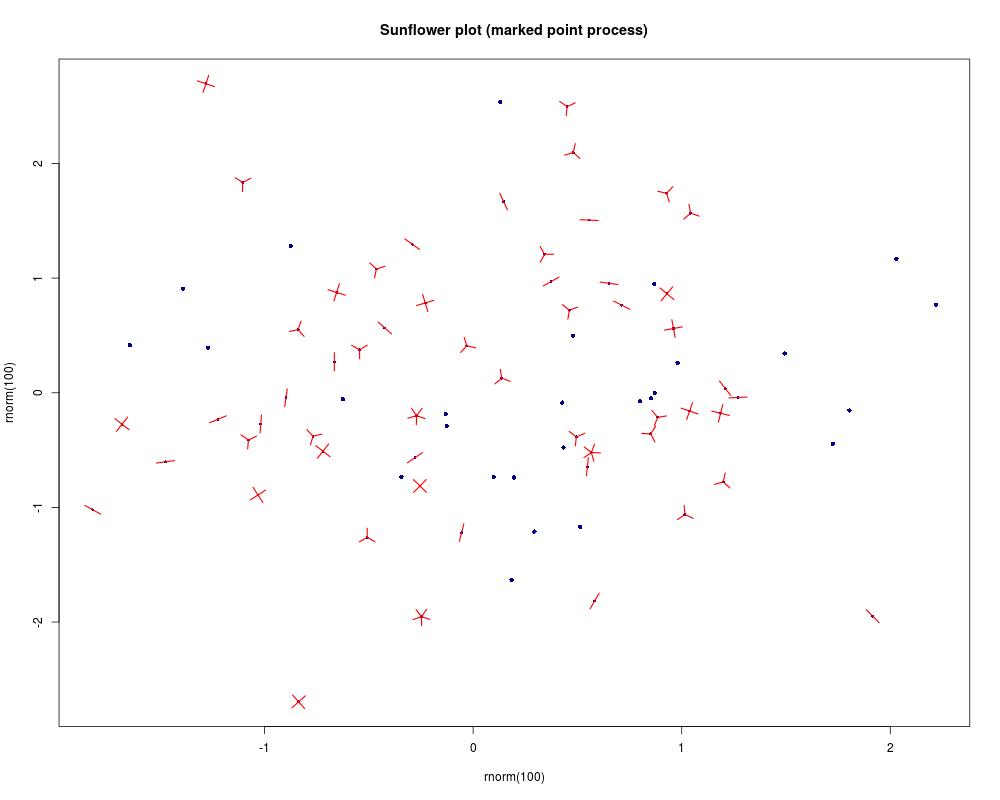
## A 'marked point process' {explicit 'number' argument}:
sunflowerplot(rnorm(100), rnorm(100), number = rpois(n = 100, lambda = 2),
main = "Sunflower plot (marked point process)",
rotate = TRUE, col = "blue4")
Results
R version 3.3.1 (2016-06-21) -- "Bug in Your Hair"
Copyright (C) 2016 The R Foundation for Statistical Computing
Platform: x86_64-pc-linux-gnu (64-bit)

R is free software and comes with ABSOLUTELY NO WARRANTY.
You are welcome to redistribute it under certain conditions.
Type 'license()' or 'licence()' for distribution details.

R is a collaborative project with many contributors.
Type 'contributors()' for more information and
'citation()' on how to cite R or R packages in publications.

Type 'demo()' for some demos, 'help()' for on-line help, or
'help.start()' for an HTML browser interface to help.
Type 'q()' to quit R.

> library(graphics)
> png(filename="/home/ddbj/snapshot/RGM3/R_rel/result/graphics/sunflowerplot.Rd_%03d_medium.png", width=480, height=480)
> ### Name: sunflowerplot
> ### Title: Produce a Sunflower Scatter Plot
> ### Aliases: sunflowerplot sunflowerplot.default sunflowerplot.formula
> ### Keywords: hplot smooth nonparametric
>
> ### ** Examples
>
> require(stats) # for rnorm
> require(grDevices)
>
> ## 'number' is computed automatically:
> sunflowerplot(iris[, 3:4])
> ## Imitating Chambers et al, p.109, closely:
> sunflowerplot(iris[, 3:4], cex = .2, cex.fact = 1, size = .035, seg.lwd = .8)
> ## or
> sunflowerplot(Petal.Width ~ Petal.Length, data = iris,
+               cex = .2, cex.fact = 1, size = .035, seg.lwd = .8)
>
>
> sunflowerplot(x = sort(2*round(rnorm(100))), y = round(rnorm(100), 0),
+               main = "Sunflower Plot of Rounded N(0,1)")
> ## Similarly using a "xyTable" argument:
> xyT <- xyTable(x = sort(2*round(rnorm(100))), y = round(rnorm(100), 0),
+                digits = 3)
> utils::str(xyT, vec.len = 20)
List of 3
 $ x     : num [1:24] -4 -4 -4 -4 -2 -2 -2 -2 -2 -2 0 0 0 0 0 2 2 2 2 2 4 4 4 4
 $ y     : num [1:24] -2 -1 0 1 -3 -2 -1 0 1 2 -2 -1 0 1 2 -2 -1 0 1 2 -2 -1 0 1
 $ number: int [1:24] 1 1 2 2 1 2 5 11 5 1 5 5 16 3 3 4 7 11 8 1 1 2 1 2
> sunflowerplot(xyT, main = "2nd Sunflower Plot of Rounded N(0,1)")
>
> ## A 'marked point process' {explicit 'number' argument}:
> sunflowerplot(rnorm(100), rnorm(100), number = rpois(n = 100, lambda = 2),
+               main = "Sunflower plot (marked point process)",
+               rotate = TRUE, col = "blue4")
>
>
>
>
>
> dev.off()
null device
          1
>
|