Supported by Dr. Osamu Ogasawara and  . . |
|
Last data update: 2014.03.03 |
Set the Clipping RegionDescriptionThese functions set the clipping region within the current viewport without altering the current coordinate system. Usage
grid.clip(...)
clipGrob(x = unit(0.5, "npc"), y = unit(0.5, "npc"),
         width = unit(1, "npc"), height = unit(1, "npc"),
         just = "centre", hjust = NULL, vjust = NULL,
         default.units = "npc", name = NULL, vp = NULL)
Arguments
DetailsBoth functions create a clip rectangle (a graphical object describing
a clip rectangle), but only Pushing or popping a viewport always overrides the clip region set by a clip grob, regardless of whether that viewport explicitly enforces a clipping region. Value
Author(s)Paul Murrell See AlsoGrid,
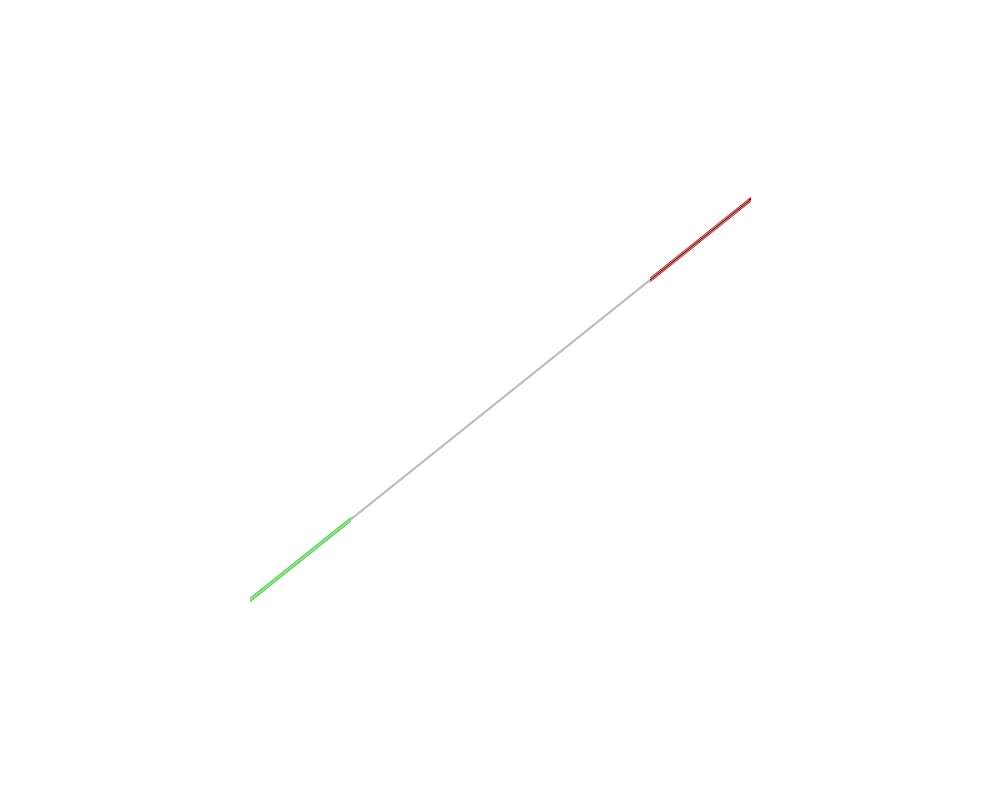
Examples# draw across entire viewport, but clipped grid.clip(x = 0.3, width = 0.1) grid.lines(gp=gpar(col="green", lwd=5)) # draw across entire viewport, but clipped (in different place) grid.clip(x = 0.7, width = 0.1) grid.lines(gp=gpar(col="red", lwd=5)) # Viewport sets new clip region pushViewport(viewport(width=0.5, height=0.5, clip=TRUE)) grid.lines(gp=gpar(col="grey", lwd=3)) # Return to original viewport; get # clip region from previous grid.clip() # (NOT from previous viewport clip region) popViewport() grid.lines(gp=gpar(col="black")) Results
R version 3.3.1 (2016-06-21) -- "Bug in Your Hair"
Copyright (C) 2016 The R Foundation for Statistical Computing
Platform: x86_64-pc-linux-gnu (64-bit)

R is free software and comes with ABSOLUTELY NO WARRANTY.
You are welcome to redistribute it under certain conditions.
Type 'license()' or 'licence()' for distribution details.

R is a collaborative project with many contributors.
Type 'contributors()' for more information and
'citation()' on how to cite R or R packages in publications.

Type 'demo()' for some demos, 'help()' for on-line help, or
'help.start()' for an HTML browser interface to help.
Type 'q()' to quit R.

> library(grid)
> png(filename="/home/ddbj/snapshot/RGM3/R_rel/result/grid/grid.clip.Rd_%03d_medium.png", width=480, height=480)
> ### Name: grid.clip
> ### Title: Set the Clipping Region
> ### Aliases: grid.clip clipGrob
> ### Keywords: dplot
>
> ### ** Examples
>
> # draw across entire viewport, but clipped
> grid.clip(x = 0.3, width = 0.1)
> grid.lines(gp=gpar(col="green", lwd=5))
> # draw across entire viewport, but clipped (in different place)
> grid.clip(x = 0.7, width = 0.1)
> grid.lines(gp=gpar(col="red", lwd=5))
> # Viewport sets new clip region
> pushViewport(viewport(width=0.5, height=0.5, clip=TRUE))
> grid.lines(gp=gpar(col="grey", lwd=3))
> # Return to original viewport;  get
> # clip region from previous grid.clip()
> # (NOT from previous viewport clip region)
> popViewport()
> grid.lines(gp=gpar(col="black"))
>
>
>
>
>
> dev.off()
null device
          1
>
|