Supported by Dr. Osamu Ogasawara and  . . |
|
Last data update: 2014.03.03 |
Draw a Diagram of a Grid LayoutDescriptionThis function uses Grid graphics to draw a diagram of a Grid layout. Usage
grid.show.layout(l, newpage=TRUE, vp.ex = 0.8, bg = "light grey",
             cell.border = "blue", cell.fill = "light blue",
             cell.label = TRUE, label.col = "blue",
             unit.col = "red", vp = NULL)
Arguments
DetailsA viewport is created within ValueNone. Author(s)Paul Murrell See AlsoGrid,
Examples
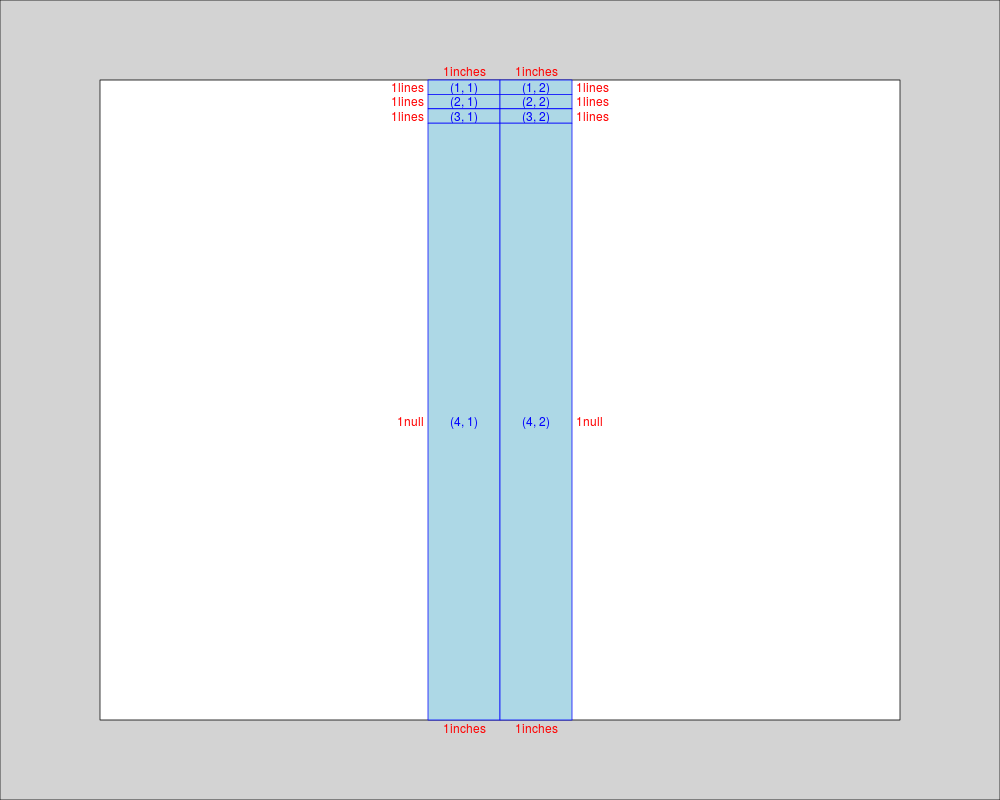
## Diagram of a simple layout
grid.show.layout(grid.layout(4,2,
                     heights=unit(rep(1, 4),
                                  c("lines", "lines", "lines", "null")),
                     widths=unit(c(1, 1), "inches")))
Results
R version 3.3.1 (2016-06-21) -- "Bug in Your Hair"
Copyright (C) 2016 The R Foundation for Statistical Computing
Platform: x86_64-pc-linux-gnu (64-bit)

R is free software and comes with ABSOLUTELY NO WARRANTY.
You are welcome to redistribute it under certain conditions.
Type 'license()' or 'licence()' for distribution details.

R is a collaborative project with many contributors.
Type 'contributors()' for more information and
'citation()' on how to cite R or R packages in publications.

Type 'demo()' for some demos, 'help()' for on-line help, or
'help.start()' for an HTML browser interface to help.
Type 'q()' to quit R.

> library(grid)
> png(filename="/home/ddbj/snapshot/RGM3/R_rel/result/grid/grid.show.layout.Rd_%03d_medium.png", width=480, height=480)
> ### Name: grid.show.layout
> ### Title: Draw a Diagram of a Grid Layout
> ### Aliases: grid.show.layout
> ### Keywords: dplot
>
> ### ** Examples
>
> ## Diagram of a simple layout
> grid.show.layout(grid.layout(4,2,
+                      heights=unit(rep(1, 4),
+                                   c("lines", "lines", "lines", "null")),
+                      widths=unit(c(1, 1), "inches")))
>
>
>
>
>
> dev.off()
null device
          1
>
|