Supported by Dr. Osamu Ogasawara and  . . |
|
Last data update: 2014.03.03 |
Return the points that would be used to draw an Xspline (or a Bezier curve).DescriptionRather than drawing an Xspline (or Bezier curve), this function returns the points that would be used to draw the series of line segments for the Xspline. This may be useful to post-process the Xspline curve, for example, to clip the curve. UsagexsplinePoints(x) bezierPoints(x) Arguments
DetailsThe points returned by this function will only be relevant for the drawing context in force when this function was called. ValueDepends on how many Xsplines would be drawn. If only one, then a list with two components, named x and y, both of which are unit objects (in inches). If several Xsplines would be drawn then the result of this function is a list of lists. Author(s)Paul Murrell See Also
Examples
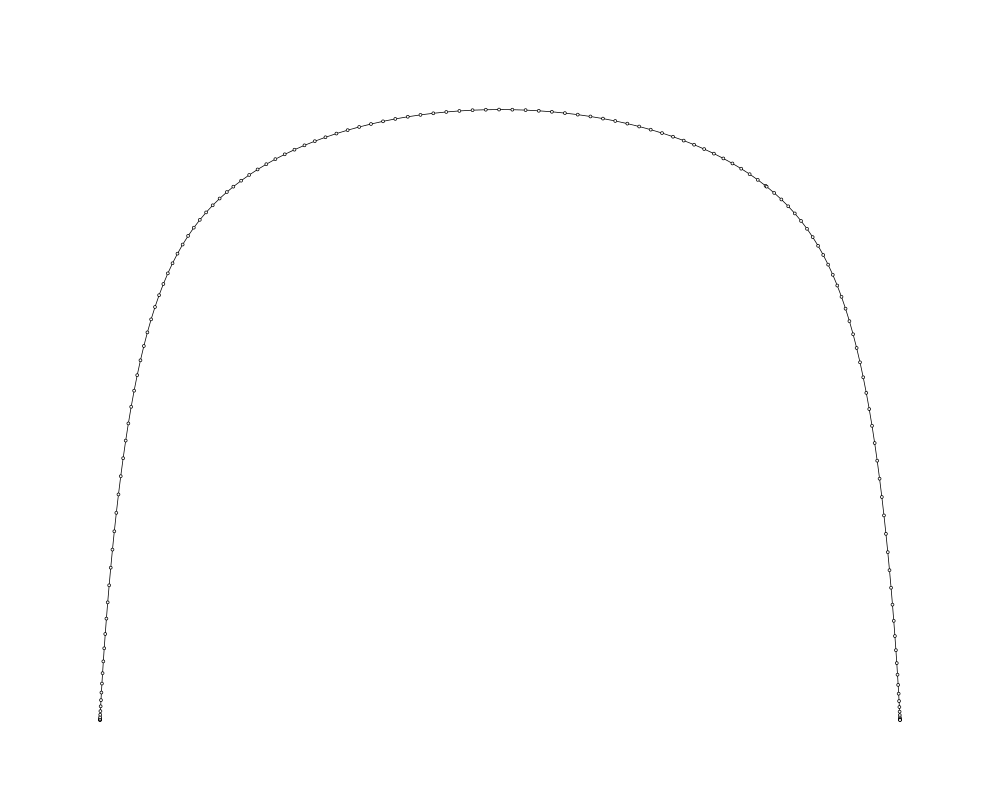
grid.newpage()
xsg <- xsplineGrob(c(.1, .1, .9, .9), c(.1, .9, .9, .1), shape=1)
grid.draw(xsg)
trace <- xsplinePoints(xsg)
grid.circle(trace$x, trace$y, default.units="inches", r=unit(.5, "mm"))
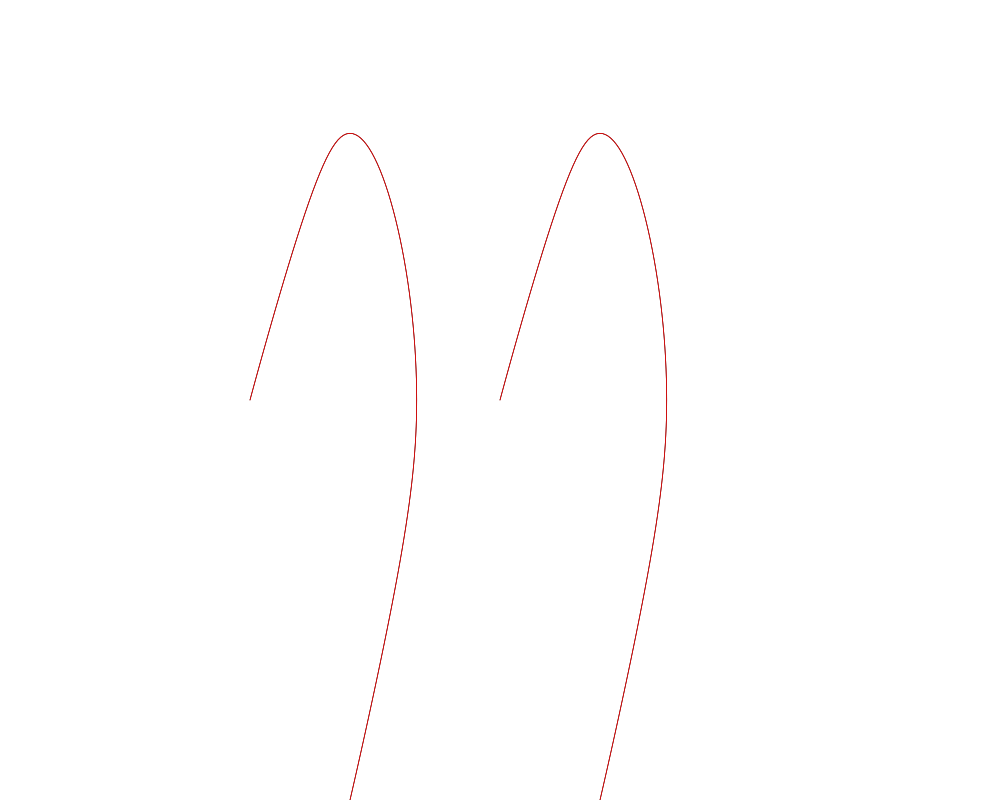
grid.newpage()
vp <- viewport(width=.5)
xg <- xsplineGrob(x=c(0, .2, .4, .2, .5, .7, .9, .7),
y=c(.5, 1, .5, 0, .5, 1, .5, 0),
id=rep(1:2, each=4),
shape=1,
vp=vp)
grid.draw(xg)
trace <- xsplinePoints(xg)
pushViewport(vp)
invisible(lapply(trace, function(t) grid.lines(t$x, t$y, gp=gpar(col="red"))))
popViewport()
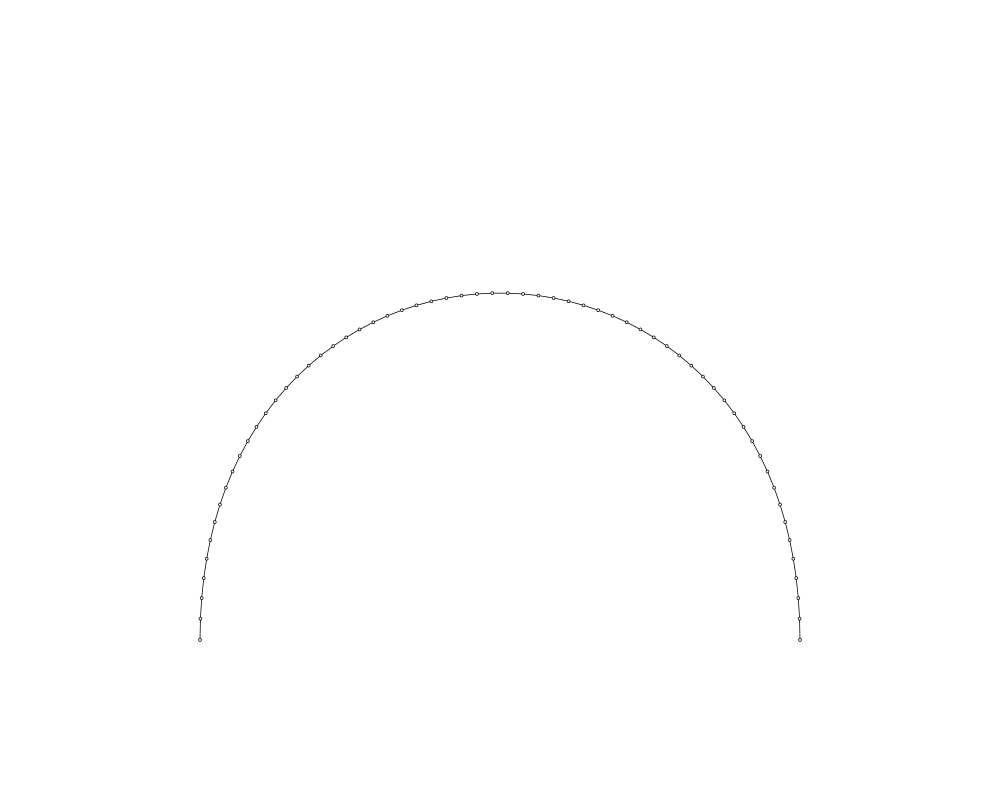
grid.newpage()
bg <- bezierGrob(c(.2, .2, .8, .8), c(.2, .8, .8, .2))
grid.draw(bg)
trace <- bezierPoints(bg)
grid.circle(trace$x, trace$y, default.units="inches", r=unit(.5, "mm"))
Results
R version 3.3.1 (2016-06-21) -- "Bug in Your Hair"
Copyright (C) 2016 The R Foundation for Statistical Computing
Platform: x86_64-pc-linux-gnu (64-bit)

R is free software and comes with ABSOLUTELY NO WARRANTY.
You are welcome to redistribute it under certain conditions.
Type 'license()' or 'licence()' for distribution details.

R is a collaborative project with many contributors.
Type 'contributors()' for more information and
'citation()' on how to cite R or R packages in publications.

Type 'demo()' for some demos, 'help()' for on-line help, or
'help.start()' for an HTML browser interface to help.
Type 'q()' to quit R.

> library(grid)
> png(filename="/home/ddbj/snapshot/RGM3/R_rel/result/grid/xsplinePoints.Rd_%03d_medium.png", width=480, height=480)
> ### Name: xsplinePoints
> ### Title: Return the points that would be used to draw an Xspline (or a
> ###   Bezier curve).
> ### Aliases: xsplinePoints bezierPoints
> ### Keywords: dplot
>
> ### ** Examples
>
> grid.newpage()
> xsg <- xsplineGrob(c(.1, .1, .9, .9), c(.1, .9, .9, .1), shape=1)
> grid.draw(xsg)
> trace <- xsplinePoints(xsg)
> grid.circle(trace$x, trace$y, default.units="inches", r=unit(.5, "mm"))
>
> grid.newpage()
> vp <- viewport(width=.5)
> xg <- xsplineGrob(x=c(0, .2, .4, .2, .5, .7, .9, .7),
+                   y=c(.5, 1, .5, 0, .5, 1, .5, 0),
+                   id=rep(1:2, each=4),
+                   shape=1,
+                   vp=vp)
> grid.draw(xg)
> trace <- xsplinePoints(xg)
> pushViewport(vp)
> invisible(lapply(trace, function(t) grid.lines(t$x, t$y, gp=gpar(col="red"))))
> popViewport()
>
> grid.newpage()
> bg <- bezierGrob(c(.2, .2, .8, .8), c(.2, .8, .8, .2))
> grid.draw(bg)
> trace <- bezierPoints(bg)
> grid.circle(trace$x, trace$y, default.units="inches", r=unit(.5, "mm"))
>
>
>
>
>
> dev.off()
null device
          1
>
|