Supported by Dr. Osamu Ogasawara and  . . |
|
Last data update: 2014.03.03 |
Add ideogram trackDescriptionAdd ideogram track Usage
add_ideogram_track(cytoband = system.file("extdata", "cytoBand.txt",
    package = "circlize"), species = NULL, track = current_track() + 1)
Arguments
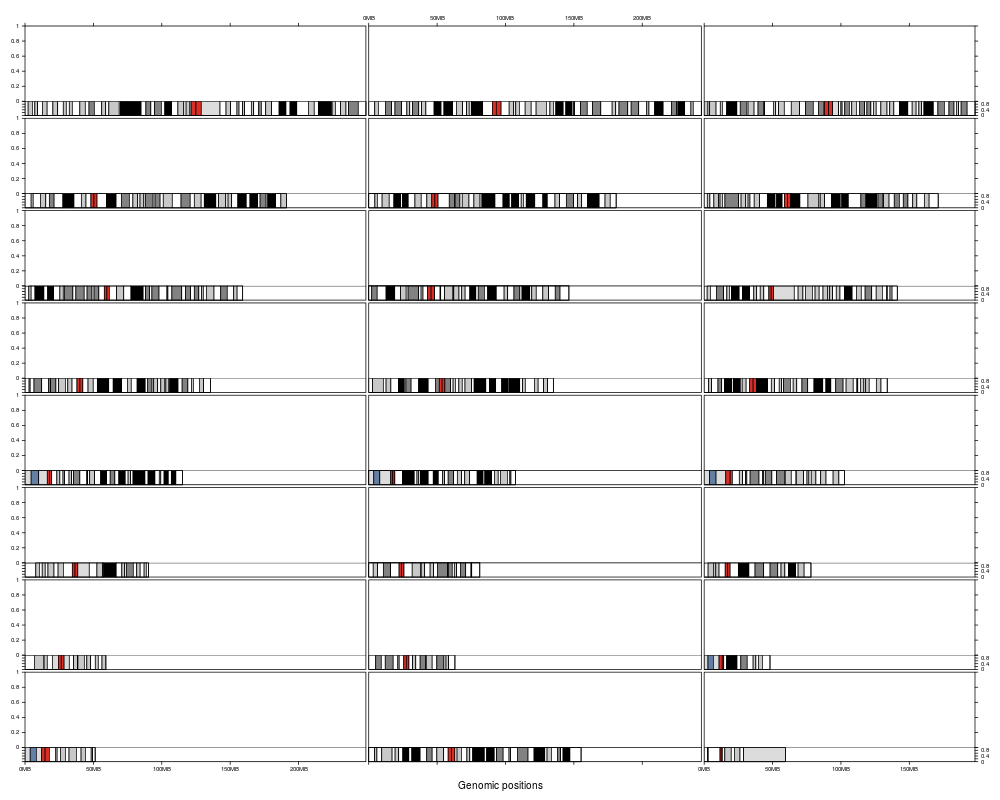
DetailsA track which contains ideograms will be added to the plot. The function tries to download cytoband file from UCSC ftp. If there is no cytoband file available for the species, there will be an error. ValueNo value is returned. Author(s)Zuguang Gu <z.gu@dkfz.de> Examples
gtrellis_layout(n_track = 2, ncol = 3,
    track_height = unit.c(unit(1, "null"), unit(5, "mm")))
add_ideogram_track(track = 2)
Results
R version 3.3.1 (2016-06-21) -- "Bug in Your Hair"
Copyright (C) 2016 The R Foundation for Statistical Computing
Platform: x86_64-pc-linux-gnu (64-bit)

R is free software and comes with ABSOLUTELY NO WARRANTY.
You are welcome to redistribute it under certain conditions.
Type 'license()' or 'licence()' for distribution details.

R is a collaborative project with many contributors.
Type 'contributors()' for more information and
'citation()' on how to cite R or R packages in publications.

Type 'demo()' for some demos, 'help()' for on-line help, or
'help.start()' for an HTML browser interface to help.
Type 'q()' to quit R.

> library(gtrellis)
Loading required package: grid
Loading required package: IRanges
Loading required package: BiocGenerics
Loading required package: parallel

Attaching package: 'BiocGenerics'

The following objects are masked from 'package:parallel':

    clusterApply, clusterApplyLB, clusterCall, clusterEvalQ,
    clusterExport, clusterMap, parApply, parCapply, parLapply,
    parLapplyLB, parRapply, parSapply, parSapplyLB

The following objects are masked from 'package:stats':

    IQR, mad, xtabs

The following objects are masked from 'package:base':

    Filter, Find, Map, Position, Reduce, anyDuplicated, append,
    as.data.frame, cbind, colnames, do.call, duplicated, eval, evalq,
    get, grep, grepl, intersect, is.unsorted, lapply, lengths, mapply,
    match, mget, order, paste, pmax, pmax.int, pmin, pmin.int, rank,
    rbind, rownames, sapply, setdiff, sort, table, tapply, union,
    unique, unsplit

Loading required package: S4Vectors
Loading required package: stats4

Attaching package: 'S4Vectors'

The following objects are masked from 'package:base':

    colMeans, colSums, expand.grid, rowMeans, rowSums

Loading required package: GenomicRanges
Loading required package: GenomeInfoDb
> png(filename="/home/ddbj/snapshot/RGM3/R_BC/result/gtrellis/add_ideogram_track.rd_%03d_medium.png", width=480, height=480)
> ### Name: add_ideogram_track
> ### Title: Add ideogram track
> ### Aliases: add_ideogram_track
>
> ### ** Examples
>
> gtrellis_layout(n_track = 2, ncol = 3,
+     track_height = unit.c(unit(1, "null"), unit(5, "mm")))
> add_ideogram_track(track = 2)
>
>
>
>
>
>
> dev.off()
null device
          1
>
|
Created & Maintained by Osamu Ogasawara (osamu.ogasawara@gmail.com) and 