Supported by Dr. Osamu Ogasawara and  . . |
|
Last data update: 2014.03.03 |
Add self-defined graphics track by trackDescriptionAdd self-defined graphics track by track Usage
add_track(gr = NULL, category = NULL, track = current_track() + 1,
    clip = TRUE, panel_fun = function(gr) NULL, panel.fun = NULL)
Arguments
DetailsInitialization of the Trellis layout and adding graphics are two independent steps.
Once the layout initialization finished, each cell will be an independent plotting region.
As same as When adding graphics in each cell, Since this package is implemented by the
    grid.points(x, y)
    grid.lines(x, y)
    grid.rect(x, y, width, height)
Graphical parameters are usually passed by
    grid.points(x, y, gp = gpar(col = "red")
    grid.rect(x, y, width, height, gp = gpar(fill = "black", col = "red"))
    grid.points(x, y, default.units = "npc")
    grid.rect(x, y, width = unit(1, "cm"))
You can refer to the documentations and vignettes of ValueNo value is returned. Author(s)Zuguang Gu <z.gu@dkfz.de> See AlsoThere are several functions which draw specific graphics and are implemented by
Examples
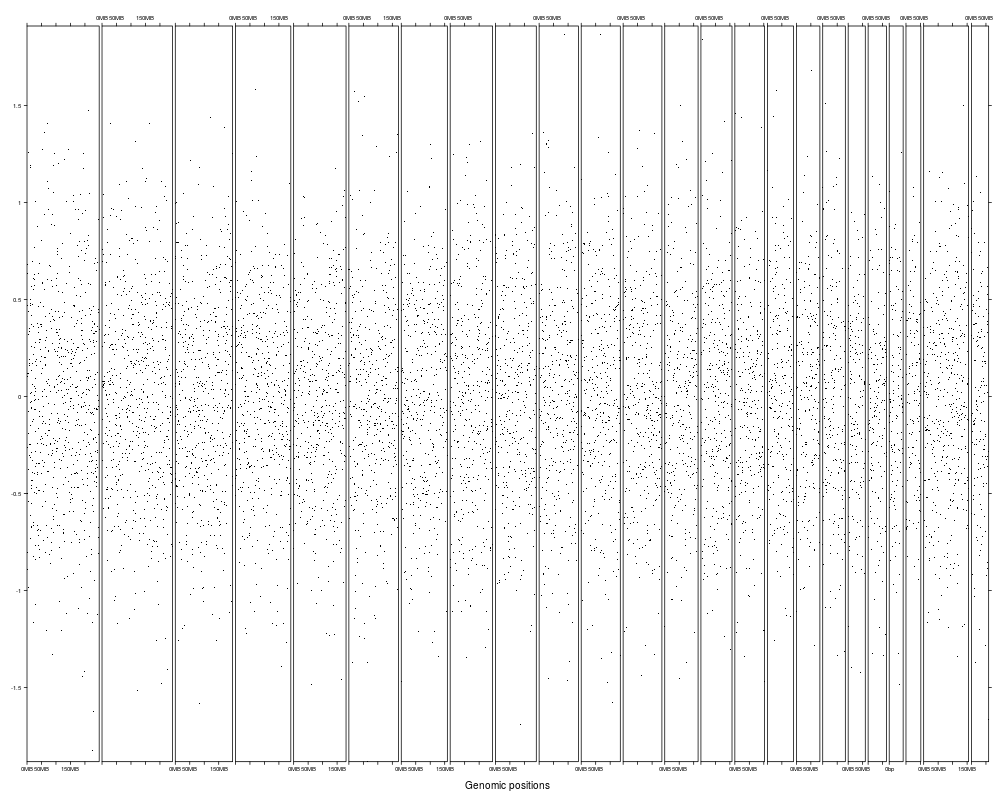
require(circlize)
bed = circlize::generateRandomBed()
gtrellis_layout(track_ylim = range(bed[[4]]))
add_track(bed, panel.fun = function(bed) {
x = (bed[[2]] + bed[[3]]) / 2
y = bed[[4]]
grid.points(x, y, pch = 16, size = unit(0.5, "mm"))
})
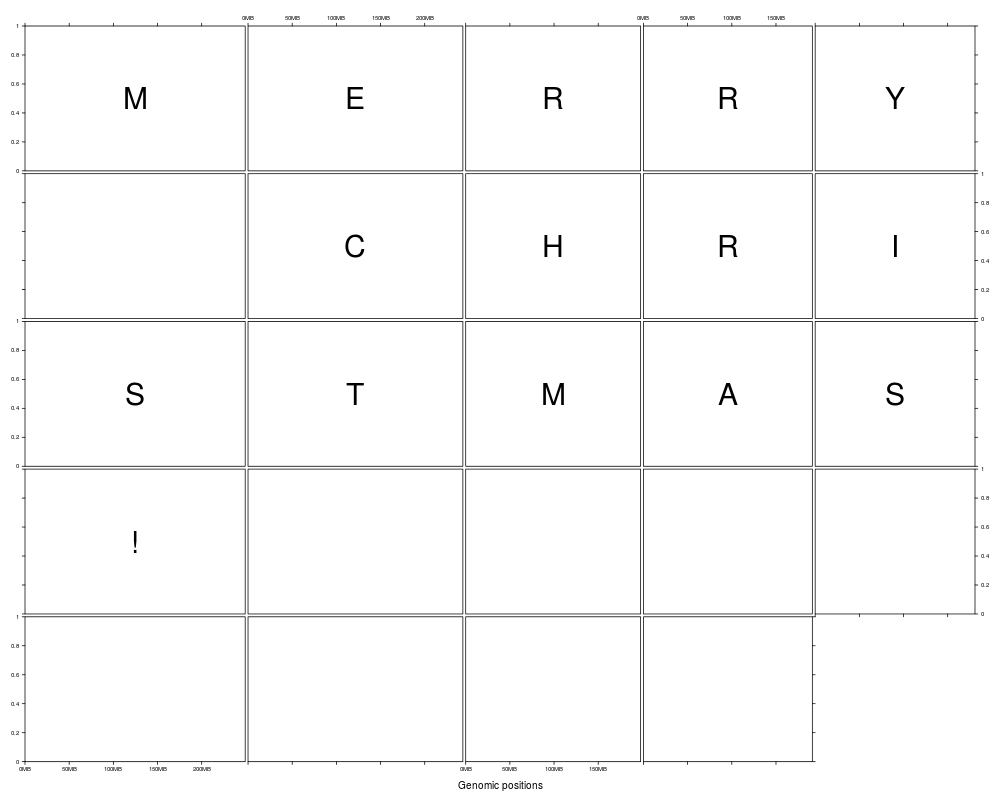
# you can add graphics in any cell by specifying `category` and `track`
all_chr = paste0("chr", 1:22)
letter = strsplit("MERRY CHRISTMAS!", "")[[1]]
gtrellis_layout(nrow = 5)
for(i in seq_along(letter)) {
add_track(category = all_chr[i], track = 1, panel.fun = function(gr) {
grid.text(letter[i], gp = gpar(fontsize = 30))
})
}
Results
R version 3.3.1 (2016-06-21) -- "Bug in Your Hair"
Copyright (C) 2016 The R Foundation for Statistical Computing
Platform: x86_64-pc-linux-gnu (64-bit)

R is free software and comes with ABSOLUTELY NO WARRANTY.
You are welcome to redistribute it under certain conditions.
Type 'license()' or 'licence()' for distribution details.

R is a collaborative project with many contributors.
Type 'contributors()' for more information and
'citation()' on how to cite R or R packages in publications.

Type 'demo()' for some demos, 'help()' for on-line help, or
'help.start()' for an HTML browser interface to help.
Type 'q()' to quit R.

> library(gtrellis)
Loading required package: grid
Loading required package: IRanges
Loading required package: BiocGenerics
Loading required package: parallel

Attaching package: 'BiocGenerics'

The following objects are masked from 'package:parallel':

    clusterApply, clusterApplyLB, clusterCall, clusterEvalQ,
    clusterExport, clusterMap, parApply, parCapply, parLapply,
    parLapplyLB, parRapply, parSapply, parSapplyLB

The following objects are masked from 'package:stats':

    IQR, mad, xtabs

The following objects are masked from 'package:base':

    Filter, Find, Map, Position, Reduce, anyDuplicated, append,
    as.data.frame, cbind, colnames, do.call, duplicated, eval, evalq,
    get, grep, grepl, intersect, is.unsorted, lapply, lengths, mapply,
    match, mget, order, paste, pmax, pmax.int, pmin, pmin.int, rank,
    rbind, rownames, sapply, setdiff, sort, table, tapply, union,
    unique, unsplit

Loading required package: S4Vectors
Loading required package: stats4

Attaching package: 'S4Vectors'

The following objects are masked from 'package:base':

    colMeans, colSums, expand.grid, rowMeans, rowSums

Loading required package: GenomicRanges
Loading required package: GenomeInfoDb
> png(filename="/home/ddbj/snapshot/RGM3/R_BC/result/gtrellis/add_track.rd_%03d_medium.png", width=480, height=480)
> ### Name: add_track
> ### Title: Add self-defined graphics track by track
> ### Aliases: add_track
>
> ### ** Examples
>
> require(circlize)
Loading required package: circlize
> bed = circlize::generateRandomBed()
> gtrellis_layout(track_ylim = range(bed[[4]]))
> add_track(bed, panel.fun = function(bed) {
+     x = (bed[[2]] + bed[[3]]) / 2
+     y = bed[[4]]
+     grid.points(x, y, pch = 16, size = unit(0.5, "mm"))
+ })
Warning message:
In add_track(bed, panel.fun = function(bed) { :
  `panel.fun` is deprecated, please use `panel_fun`.
>
> # you can add graphics in any cell by specifying `category` and `track`
> all_chr = paste0("chr", 1:22)
> letter = strsplit("MERRY CHRISTMAS!", "")[[1]]
> gtrellis_layout(nrow = 5)
> for(i in seq_along(letter)) {
+     add_track(category = all_chr[i], track = 1, panel.fun = function(gr) {
+         grid.text(letter[i], gp = gpar(fontsize = 30))
+     })
+ }
There were 16 warnings (use warnings() to see them)
>
>
>
>
>
>
> dev.off()
null device
          1
>
|