Supported by Dr. Osamu Ogasawara and  . . |
|
Last data update: 2014.03.03 |
geom_h5vcDescriptionPlotting function that returns a Usagegeom_h5vc( data, sampledata, samples=sampledata$Sample, windowsize, position, dataset, ... ) Arguments
DetailsCreates a ggplot layer centered on Ths function allows for fast creation of overview plots similar to ValueA Author(s)Paul Pyl Examples
# loading library and example data
library(h5vc)
library(ggplot2)
tallyFile <- system.file( "extdata", "example.tally.hfs5", package = "h5vcData" )
sampleData <- getSampleData( tallyFile, "/ExampleStudy/16" )
position <- 29979629
windowsize <- 30
samples <- sampleData$Sample[sampleData$Patient == "Patient8"]
data <- h5dapply(
filename = tallyFile,
group = "/ExampleStudy/16",
blocksize = windowsize * 3, #choose blocksize larger than range so that all needed data is collected as one block
names = c("Coverages", "Counts", "Deletions"),
range = c(position - windowsize, position + windowsize)
)[[1]]
# Summing up all mismatches irrespective of the alternative allele
data$CountsAggregate = colSums(data$Counts)
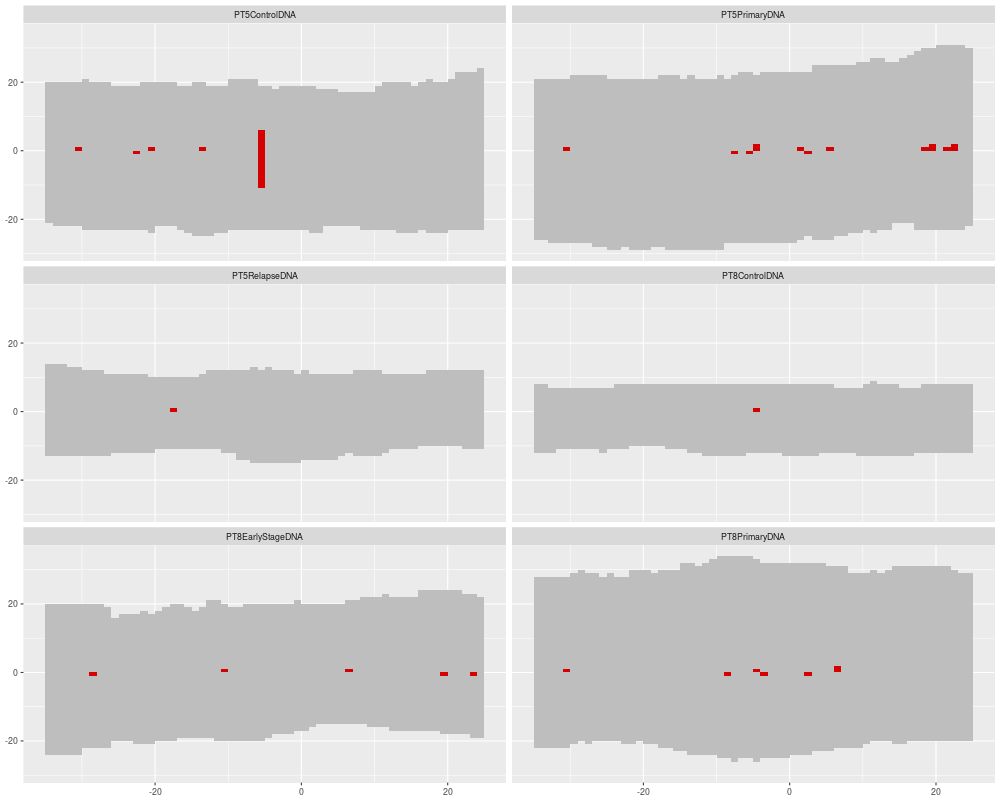
# Simple overview plot showing number of mismatches per position
p <- ggplot() +
geom_h5vc( data=data, sampledata=sampleData, windowsize = 35, position = 500, dataset = "Coverages", fill = "gray" ) +
geom_h5vc( data=data, sampledata=sampleData, windowsize = 35, position = 500, dataset = "CountsAggregate", fill = "#D50000" ) +
facet_wrap( ~ Sample, ncol = 2 )
print(p)
Results
R version 3.3.1 (2016-06-21) -- "Bug in Your Hair"
Copyright (C) 2016 The R Foundation for Statistical Computing
Platform: x86_64-pc-linux-gnu (64-bit)

R is free software and comes with ABSOLUTELY NO WARRANTY.
You are welcome to redistribute it under certain conditions.
Type 'license()' or 'licence()' for distribution details.

R is a collaborative project with many contributors.
Type 'contributors()' for more information and
'citation()' on how to cite R or R packages in publications.

Type 'demo()' for some demos, 'help()' for on-line help, or
'help.start()' for an HTML browser interface to help.
Type 'q()' to quit R.

> library(h5vc)
Loading required package: grid
Loading required package: gridExtra
Loading required package: ggplot2
> png(filename="/home/ddbj/snapshot/RGM3/R_BC/result/h5vc/geom_h5vc.Rd_%03d_medium.png", width=480, height=480)
> ### Name: geom_h5vc
> ### Title: geom_h5vc
> ### Aliases: geom_h5vc
>
> ### ** Examples
>
>   # loading library and example data
>   library(h5vc)
>   library(ggplot2)
>   tallyFile <- system.file( "extdata", "example.tally.hfs5", package = "h5vcData" )
>   sampleData <- getSampleData( tallyFile, "/ExampleStudy/16" )
>   position <- 29979629
>   windowsize <- 30
>   samples <- sampleData$Sample[sampleData$Patient == "Patient8"]
>   data <- h5dapply(
+     filename = tallyFile,
+     group = "/ExampleStudy/16",
+     blocksize = windowsize * 3, #choose blocksize larger than range so that all needed data is collected as one block
+     names = c("Coverages", "Counts", "Deletions"),
+     range = c(position - windowsize, position + windowsize)
+   )[[1]]
>   # Summing up all mismatches irrespective of the alternative allele
>   data$CountsAggregate = colSums(data$Counts)
>   # Simple overview plot showing number of mismatches per position
>   p <- ggplot() +
+   geom_h5vc( data=data, sampledata=sampleData, windowsize = 35, position = 500, dataset = "Coverages", fill = "gray" ) +
+   geom_h5vc( data=data, sampledata=sampleData, windowsize = 35, position = 500, dataset = "CountsAggregate", fill = "#D50000" ) +
+   facet_wrap( ~ Sample, ncol = 2 )
>   print(p)
>
>
>
>
>
> dev.off()
null device
          1
>
|