Supported by Dr. Osamu Ogasawara and  . . |
|
Last data update: 2014.03.03 |
mismatchPlotDescriptionPlotting function that returns a UsagemismatchPlot( data, sampledata, samples=sampledata$Sample, windowsize = NULL, position = NULL, range = NULL, plotReference = TRUE, refHeight=8, tickSpacing = c(10,10) ) Arguments
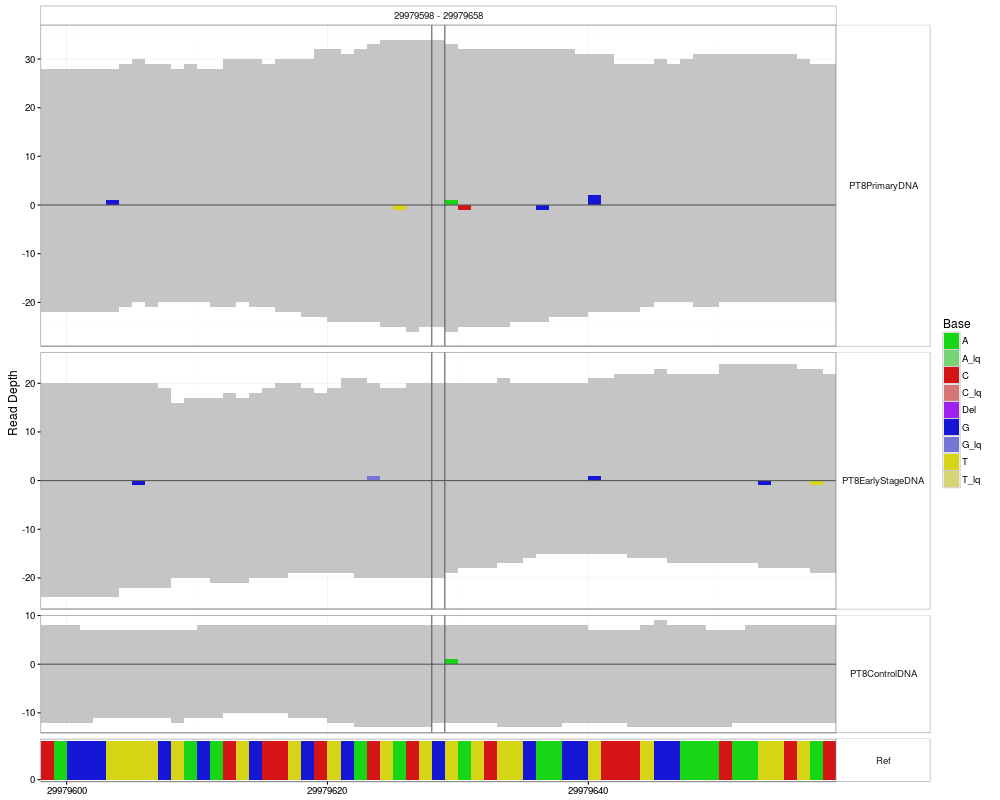
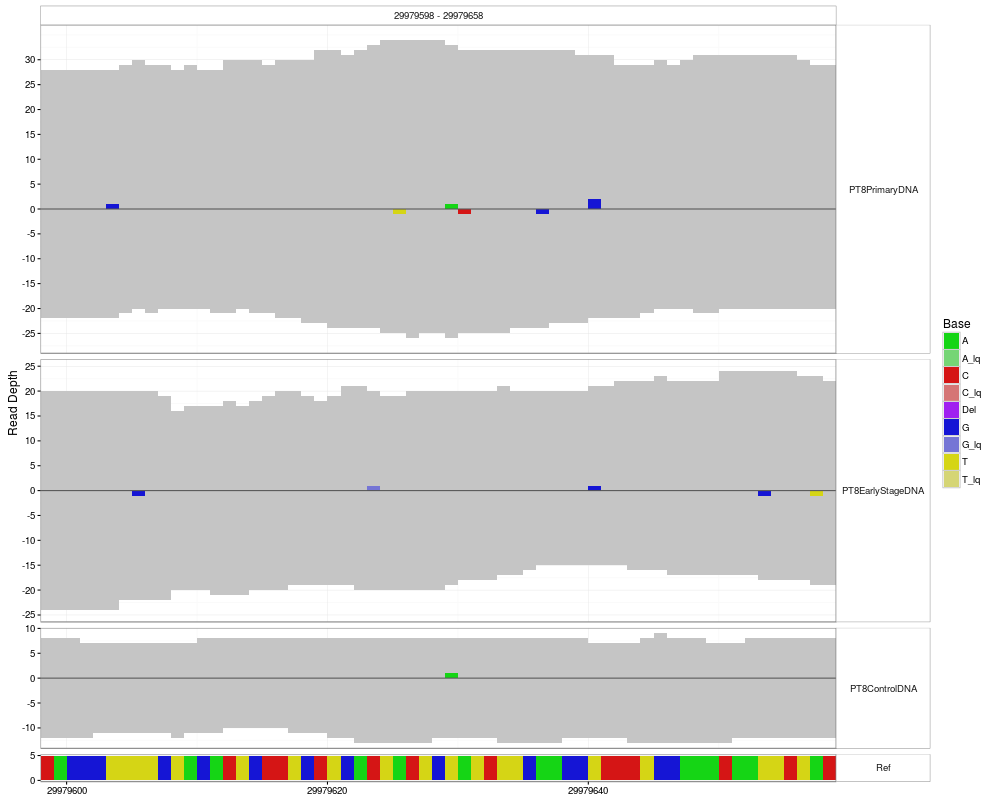
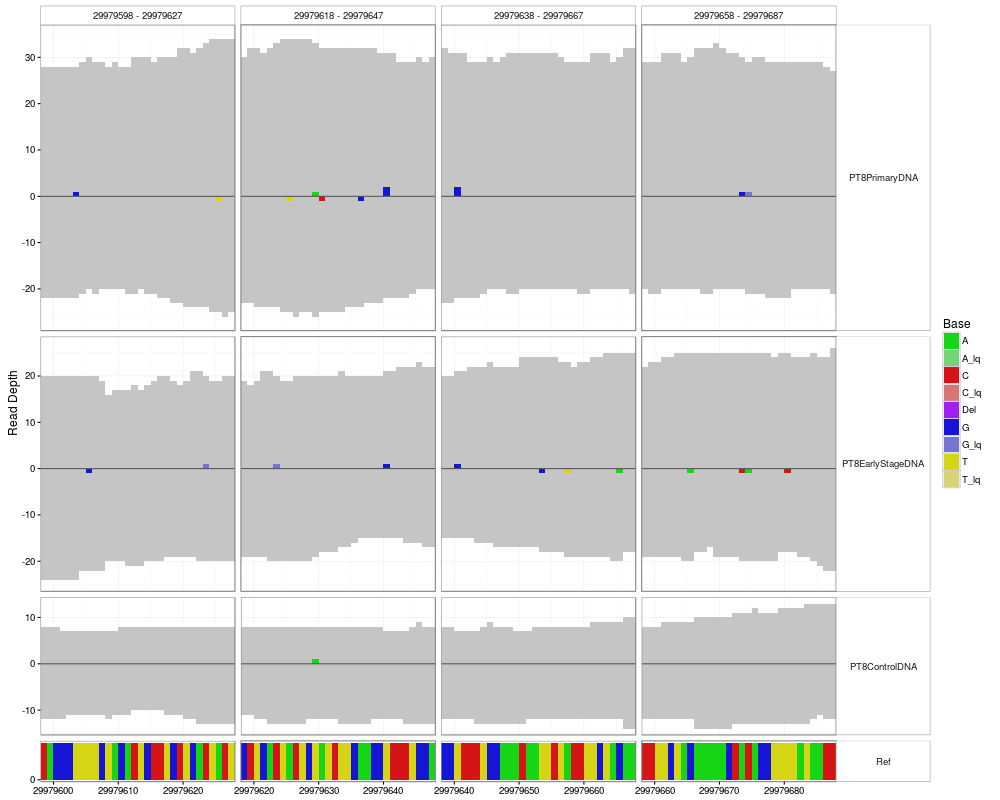
DetailsIf If neither The plot has the genomic position on the x-axis. The y-axis encodes values where positive values are on the forward strand and negative values on the reverse. The coverage is shown in grey, deletions in purple and the mismatches in the colors specified in the legend. Note that for each possible mismatch there is an additional color for low-quality counts (coming from the first and last sequencing cycles), so e.g. If data is the result of a call to ValueA Author(s)Paul Pyl Examples
  # loading library and example data
  library(h5vc)
  tallyFile <- system.file( "extdata", "example.tally.hfs5", package = "h5vcData" )
  sampleData <- getSampleData( tallyFile, "/ExampleStudy/16" )
  position <- 29979628
  windowsize <- 30
  samples <- sampleData$Sample[sampleData$Patient == "Patient8"]
  data <- h5readBlock(
    filename = tallyFile,
    group = "/ExampleStudy/16",
    names = c("Coverages", "Counts", "Deletions", "Reference"),
    range = c(position - windowsize, position + windowsize)
  )
  #Plotting with position and windowsize
  p <- mismatchPlot(
    data = data,
    sampledata = sampleData,
    samples = samples,
    windowsize = windowsize,
    position = position
  )
  print(p)
  #plotting with range and modified tickSpacing and refHeight
  p <- mismatchPlot(
    data = data,
    sampledata = sampleData,
    samples = samples,
    range = c(position - windowsize, position + windowsize),
    tickSpacing = c(20, 5),
    refHeight = 5
  )
  print(p)
  #plotting without specfiying range or position
  p <- mismatchPlot(
    data = data,
    sampledata = sampleData,
    samples = samples
  )
  print(p)
  #Plotting multiple regions (with small overlaps)
  library(IRanges)
  dataList <- h5dapply(
    filename = tallyFile,
    group = "/ExampleStudy/16",
    names = c("Coverages", "Counts", "Deletions", "Reference"),
    range = IRanges(start = seq( position - windowsize, position + windowsize, 20), width = 30 )
  )
  p <- mismatchPlot(
    data = dataList,
    sampledata = sampleData,
    samples = samples
  )
  print(p)
Results
R version 3.3.1 (2016-06-21) -- "Bug in Your Hair"
Copyright (C) 2016 The R Foundation for Statistical Computing
Platform: x86_64-pc-linux-gnu (64-bit)

R is free software and comes with ABSOLUTELY NO WARRANTY.
You are welcome to redistribute it under certain conditions.
Type 'license()' or 'licence()' for distribution details.

R is a collaborative project with many contributors.
Type 'contributors()' for more information and
'citation()' on how to cite R or R packages in publications.

Type 'demo()' for some demos, 'help()' for on-line help, or
'help.start()' for an HTML browser interface to help.
Type 'q()' to quit R.

> library(h5vc)
Loading required package: grid
Loading required package: gridExtra
Loading required package: ggplot2
> png(filename="/home/ddbj/snapshot/RGM3/R_BC/result/h5vc/mismatchPlot.Rd_%03d_medium.png", width=480, height=480)
> ### Name: mismatchPlot
> ### Title: mismatchPlot
> ### Aliases: mismatchPlot
>
> ### ** Examples
>
>   # loading library and example data
>   library(h5vc)
>   tallyFile <- system.file( "extdata", "example.tally.hfs5", package = "h5vcData" )
>   sampleData <- getSampleData( tallyFile, "/ExampleStudy/16" )
>   position <- 29979628
>   windowsize <- 30
>   samples <- sampleData$Sample[sampleData$Patient == "Patient8"]
>   data <- h5readBlock(
+     filename = tallyFile,
+     group = "/ExampleStudy/16",
+     names = c("Coverages", "Counts", "Deletions", "Reference"),
+     range = c(position - windowsize, position + windowsize)
+   )
>   #Plotting with position and windowsize
>   p <- mismatchPlot(
+     data = data,
+     sampledata = sampleData,
+     samples = samples,
+     windowsize = windowsize,
+     position = position
+   )
>   print(p)
>   #plotting with range and modified tickSpacing and refHeight
>   p <- mismatchPlot(
+     data = data,
+     sampledata = sampleData,
+     samples = samples,
+     range = c(position - windowsize, position + windowsize),
+     tickSpacing = c(20, 5),
+     refHeight = 5
+   )
>   print(p)
>   #plotting without specfiying range or position
>   p <- mismatchPlot(
+     data = data,
+     sampledata = sampleData,
+     samples = samples
+   )
>   print(p)
>   #Plotting multiple regions (with small overlaps)
>   library(IRanges)
Loading required package: BiocGenerics
Loading required package: parallel

Attaching package: 'BiocGenerics'

The following objects are masked from 'package:parallel':

    clusterApply, clusterApplyLB, clusterCall, clusterEvalQ,
    clusterExport, clusterMap, parApply, parCapply, parLapply,
    parLapplyLB, parRapply, parSapply, parSapplyLB

The following object is masked from 'package:gridExtra':

    combine

The following objects are masked from 'package:stats':

    IQR, mad, xtabs

The following objects are masked from 'package:base':

    Filter, Find, Map, Position, Reduce, anyDuplicated, append,
    as.data.frame, cbind, colnames, do.call, duplicated, eval, evalq,
    get, grep, grepl, intersect, is.unsorted, lapply, lengths, mapply,
    match, mget, order, paste, pmax, pmax.int, pmin, pmin.int, rank,
    rbind, rownames, sapply, setdiff, sort, table, tapply, union,
    unique, unsplit

Loading required package: S4Vectors
Loading required package: stats4

Attaching package: 'S4Vectors'

The following objects are masked from 'package:base':

    colMeans, colSums, expand.grid, rowMeans, rowSums

>   dataList <- h5dapply(
+     filename = tallyFile,
+     group = "/ExampleStudy/16",
+     names = c("Coverages", "Counts", "Deletions", "Reference"),
+     range = IRanges(start = seq( position - windowsize, position + windowsize, 20), width = 30 )
+   )
>   p <- mismatchPlot(
+     data = dataList,
+     sampledata = sampleData,
+     samples = samples
+   )
>   print(p)
>
>
>
>
>
> dev.off()
null device
          1
>
|