Supported by Dr. Osamu Ogasawara and  . . |
|
Last data update: 2014.03.03 |
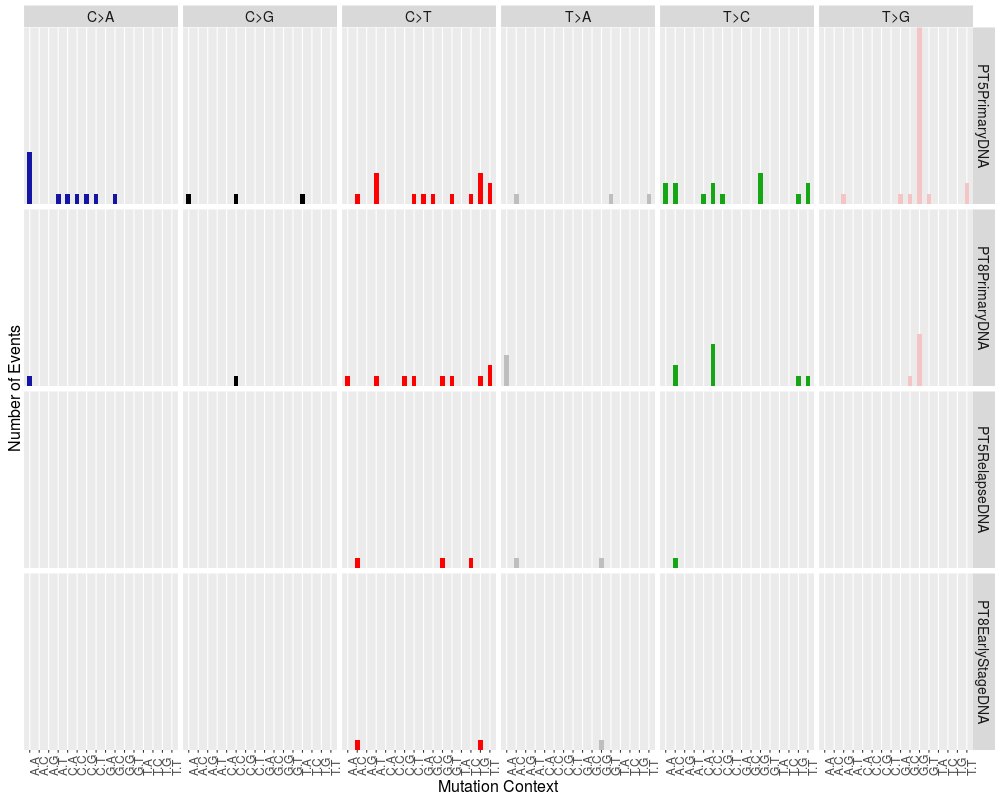
Plotting a mutation spectrumDescriptionThis function generates a mutation spectrum plot from a mutation spectrum returned by a call to UsageplotMutationSpectrum( ms, plotCounts = TRUE ) Arguments
DetailsThe plot is inspired by the one shown in figure 1b of ValueA ggplot object containing the mutation spectrum plot Author(s)Paul Pyl Exampleslibrary(h5vc) tallyFile <- system.file( "extdata", "example.tally.hfs5", package = "h5vcData" ) data( "example.variants", package = "h5vcData" ) plotMutationSpectrum( mutationSpectrum( variantCalls, tallyFile, "/ExampleStudy" ) ) Results
R version 3.3.1 (2016-06-21) -- "Bug in Your Hair"
Copyright (C) 2016 The R Foundation for Statistical Computing
Platform: x86_64-pc-linux-gnu (64-bit)

R is free software and comes with ABSOLUTELY NO WARRANTY.
You are welcome to redistribute it under certain conditions.
Type 'license()' or 'licence()' for distribution details.

R is a collaborative project with many contributors.
Type 'contributors()' for more information and
'citation()' on how to cite R or R packages in publications.

Type 'demo()' for some demos, 'help()' for on-line help, or
'help.start()' for an HTML browser interface to help.
Type 'q()' to quit R.

> library(h5vc)
Loading required package: grid
Loading required package: gridExtra
Loading required package: ggplot2
> png(filename="/home/ddbj/snapshot/RGM3/R_BC/result/h5vc/plotMutationSpectrum.Rd_%03d_medium.png", width=480, height=480)
> ### Name: plotMutationSpectrum
> ### Title: Plotting a mutation spectrum
> ### Aliases: plotMutationSpectrum
>
> ### ** Examples
>
>   library(h5vc)
>   tallyFile <- system.file( "extdata", "example.tally.hfs5", package = "h5vcData" )
>   data( "example.variants", package = "h5vcData" )
>   plotMutationSpectrum( mutationSpectrum( variantCalls, tallyFile, "/ExampleStudy" ) )
>
>
>
>
>
> dev.off()
null device
          1
>
|
Created & Maintained by Osamu Ogasawara (osamu.ogasawara@gmail.com) and 