Supported by Dr. Osamu Ogasawara and  . . |
|
Last data update: 2014.03.03 |
Plot a
|
x |
object of Bootstrap-Class |
xlabProj |
character for the x-label title for plot |
ylabProj |
character for the x-label title for plot |
mainProj |
main to proj plot |
legend |
Logical. It indicates whether the legend prints |
colour |
colours for ellipsis |
xlimi |
bounds of x-axis |
ylimi |
bounds of y-axis |
Points |
logical if is true, the points are plotted |
... |
additional parameters for plot (generics) |
Value
plotted Bootplot/s of the component/s of the given Bootstrap object.
Author(s)
M L Zingaretti, J A Demey-Zambrano, J L Vicente Villardon, J R Demey
See Also
CompPlot, TrajPlot,
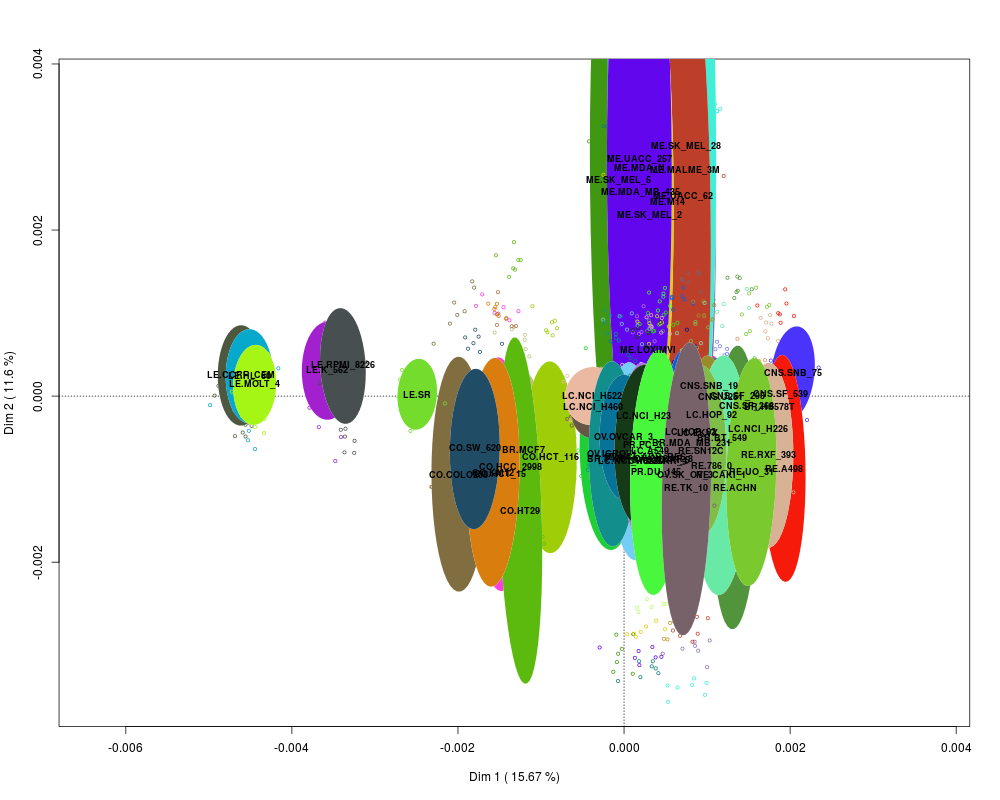
Examples
Z2<-DiStatis(NCI60Selec,Scale=TRUE,Center=TRUE)
M<-Bootstrap(Z2)
if (interactive()) {
BootPlot(M)
}
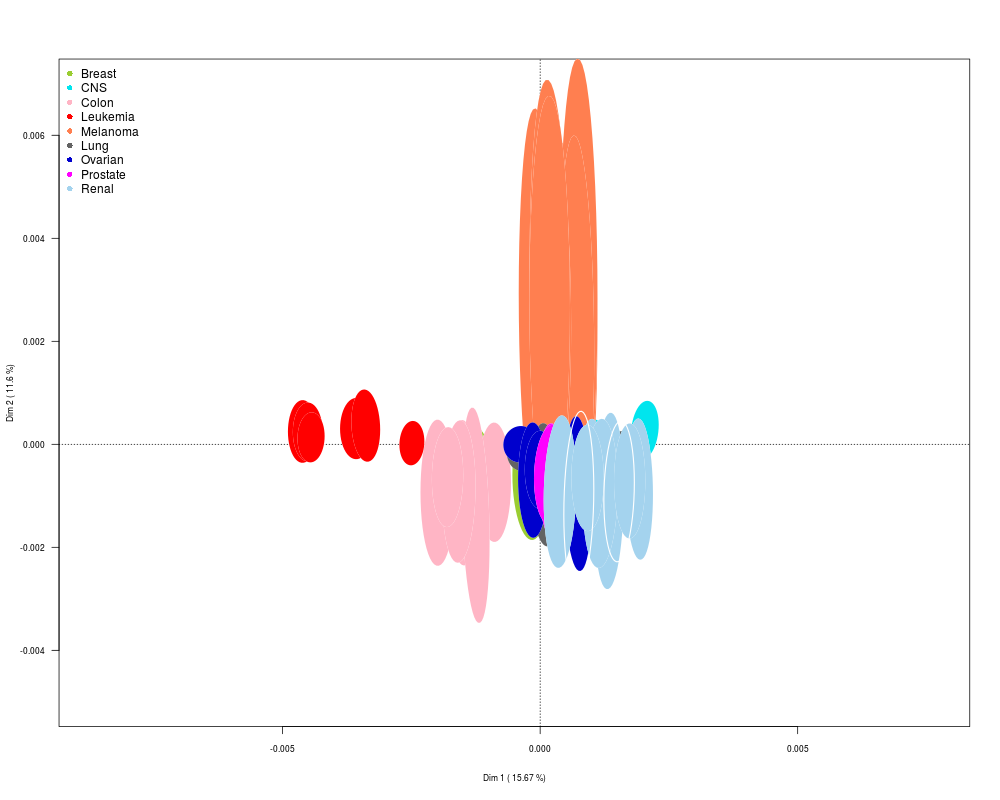
Colores2<-c(rep(colors()[657],5),rep(colors()[637],6),rep(colors()[537],7),
rep(colors()[552],6),rep(colors()[57],10),rep(colors()[300],8),
rep(colors()[461],7),rep(colors()[450],2),rep(colors()[432],7))
Colores1<-c(rep("Breast",5),rep("CNS",6),rep("Colon",7),
rep("Leukemia",6),rep("Melanoma",10),rep("Lung",8),rep("Ovarian",7),
rep("Prostate",2),rep("Renal",7))
BootPlot(M,Points=FALSE,cex.lab=0.7,cex.axis=0.7,
las=1,xlimi=c(-0.003,0.002),ylimi=c(-0.005,0.007)
,legend=FALSE,col=Colores2)
legend("topleft",unique(Colores1),col=unique(Colores2),
bty="n",pch=16,cex=1)
Results
R version 3.3.1 (2016-06-21) -- "Bug in Your Hair"
Copyright (C) 2016 The R Foundation for Statistical Computing
Platform: x86_64-pc-linux-gnu (64-bit)

R is free software and comes with ABSOLUTELY NO WARRANTY.
You are welcome to redistribute it under certain conditions.
Type 'license()' or 'licence()' for distribution details.

R is a collaborative project with many contributors.
Type 'contributors()' for more information and
'citation()' on how to cite R or R packages in publications.

Type 'demo()' for some demos, 'help()' for on-line help, or
'help.start()' for an HTML browser interface to help.
Type 'q()' to quit R.

> library(kimod)
> png(filename="/home/ddbj/snapshot/RGM3/R_BC/result/kimod/BootPlot.Rd_%03d_medium.png", width=480, height=480)
> ### Name: BootPlot
> ### Title: Plot a 'BootPlot' of a Bootstrap object
> ### Aliases: BootPlot BootPlot,Bootstrap-method
>
> ### ** Examples
>
> Z2<-DiStatis(NCI60Selec,Scale=TRUE,Center=TRUE)
The calculations were performed using the scalar product between the tables
The Projection of all variables will be made when the number of variables is less than 50
>  M<-Bootstrap(Z2)
> #if (interactive()) {
>  BootPlot(M)
> # }
>  Colores2<-c(rep(colors()[657],5),rep(colors()[637],6),rep(colors()[537],7),
+  rep(colors()[552],6),rep(colors()[57],10),rep(colors()[300],8),
+  rep(colors()[461],7),rep(colors()[450],2),rep(colors()[432],7))
>  Colores1<-c(rep("Breast",5),rep("CNS",6),rep("Colon",7),
+  rep("Leukemia",6),rep("Melanoma",10),rep("Lung",8),rep("Ovarian",7),
+  rep("Prostate",2),rep("Renal",7))
>  BootPlot(M,Points=FALSE,cex.lab=0.7,cex.axis=0.7,
+  las=1,xlimi=c(-0.003,0.002),ylimi=c(-0.005,0.007)
+  ,legend=FALSE,col=Colores2)
>  legend("topleft",unique(Colores1),col=unique(Colores2),
+  bty="n",pch=16,cex=1)
>
>
>
>
>
> dev.off()
null device
          1
>
|
Created & Maintained by Osamu Ogasawara (osamu.ogasawara@gmail.com) and 