Supported by Dr. Osamu Ogasawara and  . . |
|
Last data update: 2014.03.03 |
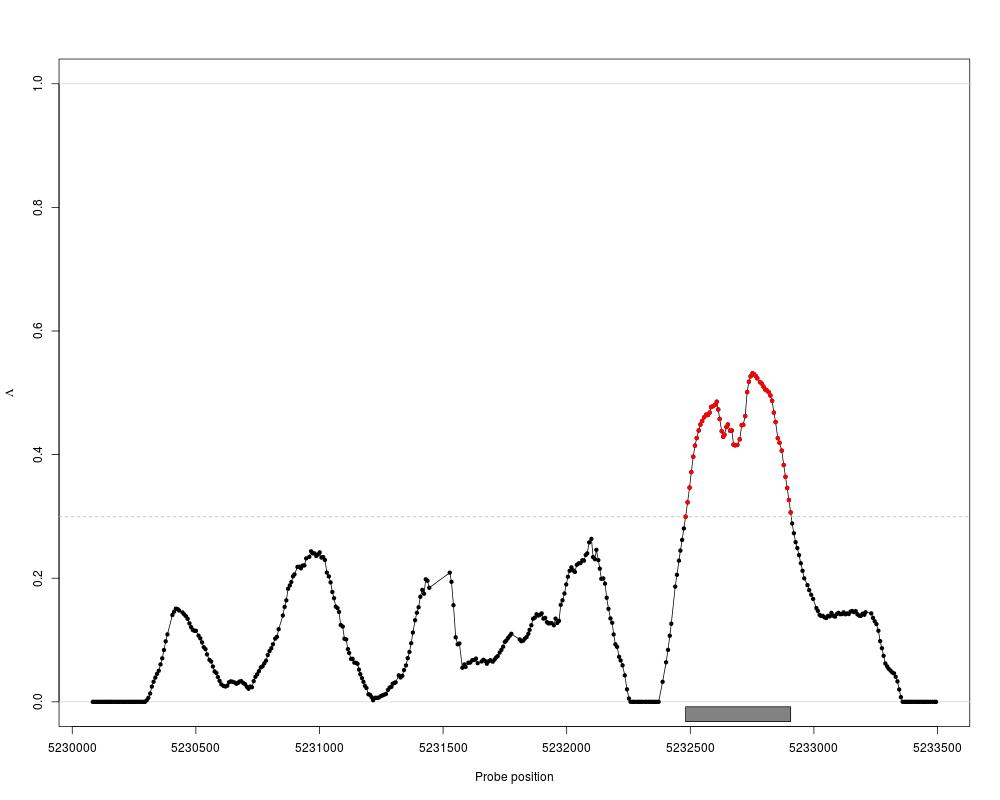
Identifying Differential Effects in Tiling Microarray DataDescriptionThe 'les' package estimates Loci of Enhanced Significance (LES) in tiling microarray data. These are regions of regulation such as found in differential transcription, CHiP-chip, or DNA modification analysis. The package provides a universal framework suitable for identifying differential effects in tiling microarray data sets, and is independent of the underlying statistics at the level of single probes. DetailsThe 'les' package provides a universal framework for detecting differential effects in tiling microarray experiments. It is universal in the sense that one is free to choose any statistical test to estimate the effect of differential effect for each probe on the tiling microarray. Provided with the p-values for each probe and the corresponding positions of the probes, 'les' uses a sliding window approach to estimate the fraction of regulated probes in the local surrounding of each probe. The approach is related to computing a spatially resolved and weighted false discovery rate, and yields a interpretable statistical feature Lambda. Resulting regions can be scored according to their overall effect. Methods for high-level plotting and export of the results to other software and genome browsers are provided. The 'les' package is published under the GPL-3 license. Author(s)Julian Gehring, Clemens Kreutz, Jens Timmer Maintainer: Julian Gehring <julian.gehring@fdm.uni-freiburg.de> Referencesin preparation This package is based on: Kilian Bartholome, Clemens Kreutz, and Jens Timmer: Estimation of gene induction enables a relevance-based ranking of gene sets, Journal of Computational Biology: A Journal of Computational Molecular Cell Biology 16, no. 7 (July 2009): 959-967. http://www.liebertonline.com/doi/abs/10.1089/cmb.2008.0226 See AlsoClass:
Methods and functions:
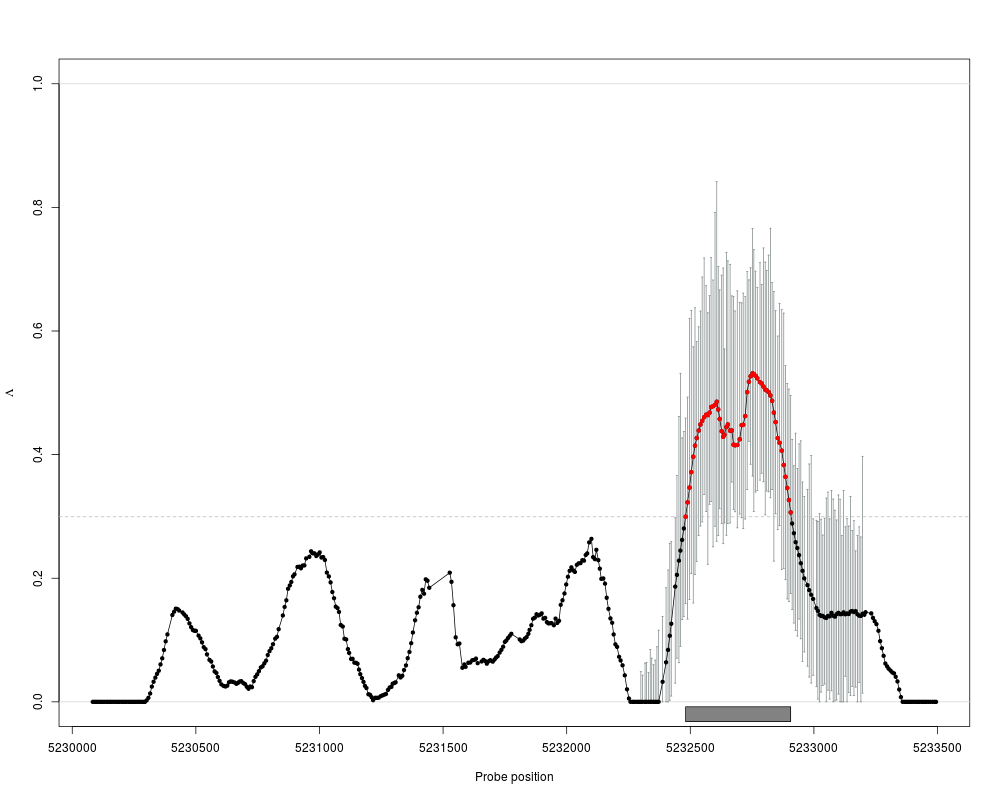
Examplesdata(spikeInStat) x <- Les(pos, pval) x <- estimate(x, 200) x <- threshold(x) x <- regions(x) subset <- pos >= 5232300 & pos <= 5233200 x <- ci(x, subset, conf=0.90, nBoot=50) ## plot data plot(x, region=TRUE) plot(x, region=TRUE, error="ci") ## Not run: ## export data of chromosome 1 export(x, file="les_out.bed", chr=1) export(x, file="les_out.wig", format="wig", chr=1) ## End(Not run) Results
R version 3.3.1 (2016-06-21) -- "Bug in Your Hair"
Copyright (C) 2016 The R Foundation for Statistical Computing
Platform: x86_64-pc-linux-gnu (64-bit)

R is free software and comes with ABSOLUTELY NO WARRANTY.
You are welcome to redistribute it under certain conditions.
Type 'license()' or 'licence()' for distribution details.

R is a collaborative project with many contributors.
Type 'contributors()' for more information and
'citation()' on how to cite R or R packages in publications.

Type 'demo()' for some demos, 'help()' for on-line help, or
'help.start()' for an HTML browser interface to help.
Type 'q()' to quit R.

> library(les)
Loading required package: fdrtool
> png(filename="/home/ddbj/snapshot/RGM3/R_BC/result/les/les-package.Rd_%03d_medium.png", width=480, height=480)
> ### Name: les-package
> ### Title: Identifying Differential Effects in Tiling Microarray Data
> ### Aliases: les-package les
> ### Keywords: package htest
>
> ### ** Examples
>
> data(spikeInStat)
>
> x <- Les(pos, pval)
> x <- estimate(x, 200)
> x <- threshold(x)
> x <- regions(x)
>
> subset <- pos >= 5232300 & pos <= 5233200
> x <- ci(x, subset, conf=0.90, nBoot=50)
>
> ## plot data
> plot(x, region=TRUE)
> plot(x, region=TRUE, error="ci")
>
> ## Not run:
> ##D ## export data of chromosome 1
> ##D export(x, file="les_out.bed", chr=1)
> ##D export(x, file="les_out.wig", format="wig", chr=1)
> ## End(Not run)
>
>
>
>
>
> dev.off()
null device
          1
>
|