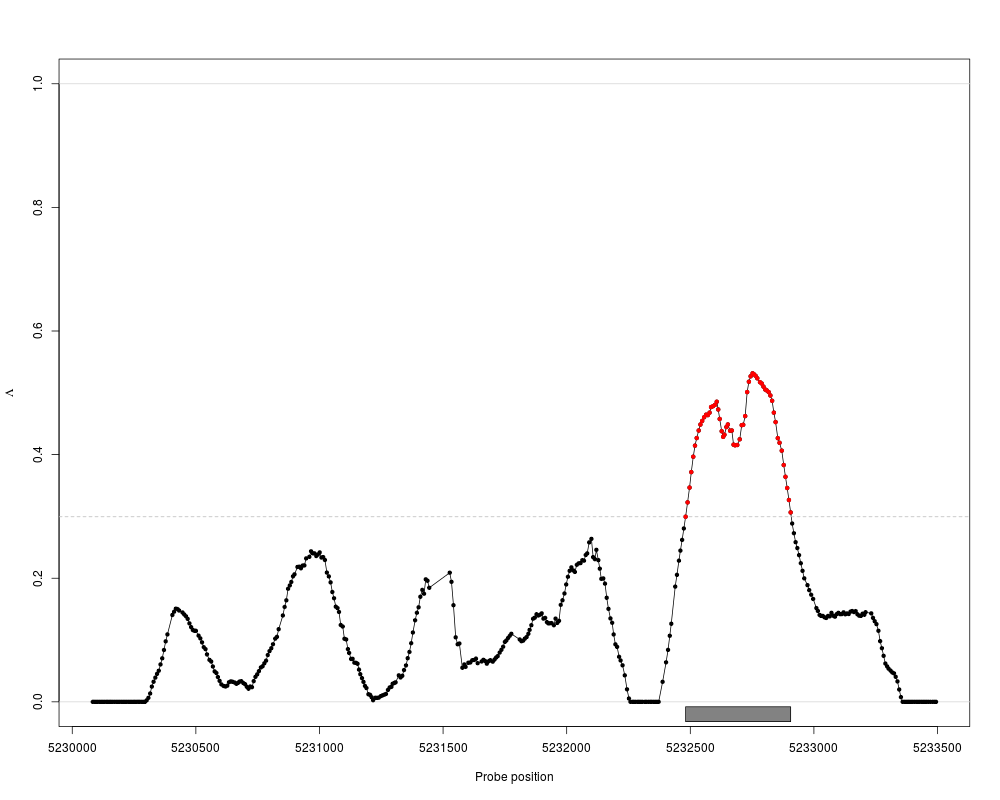
The 'plot' method plots the estimates of the 'les' package along the
genome. This includeds Lambda with confidence
intervals and estimated regions.
Usage
plot(x, y, ...)

## S4 method for signature 'Les'
plot(x, y, chr, error="none", region=FALSE, limit=TRUE,
rug=FALSE, xlim, ylim=c(0, 1),  ...)
Arguments
x
Object of class 'Les', as returned by 'estimate', 'threshold' or 'ci'.
y
Annotation object, currently not used.
chr
Character or numeric specifying which chromosome to
plot. Must have a match in 'chr' passed to 'Les'. A value is
required if the probes are located on more than one chromosome.
error
Character string specifying if error estimates for
Lambda should be plotted (default: "none"). Valid
values are "none" for no error estimates and "ci" for confidence
intervals computed by the 'ci' method.
region
Logical indicating whether the estimated regions should
be included in the plot. The 'regions' method must have been called
beforehand.
limit
Logical specifying whether the estimated threshold
Theta should be indicated on the y-axis if estimated
(default: TRUE).
rug
Logical whether the positions of the probes should be
indicated along the x-axis (default: FALSE). For details see 'rug'.
xlim
Numeric vector with two elements specifying the range on the
x-axis.
ylim
Numeric vector with two elements specifying the range on the
y-axis.
...
Optional arguments used in order to customize the plot. See
the ‘details’ section.
Details
This method provides high-level plotting for the 'Les' class.
The plot method uses a special system in order to customize the
graphical elements of the figure. It allows to refer to the different
components with the name of the additional input argument; its value
is a list containing named graphical parameters for the underlying
plot function. The following list describes the possible names and
their contribution.
plotArgs
Arguments for the axis and the labeling, passed to the
plot function.
borderArgs
Arguments for the border lines at
Lambda equal to 0 and 1, passed to the
abline function.
errorArgs
Arguments for the confidence interval of
Lambda, passed to the plotCI function of the
gplots package.
probeArgs
Arguments for the representation of probes,
passed to the points function.
limitArgs
Arguments for the horizontal line
representing the threshold Theta, passed to
the abline function.
sigArgs
Arguments for the representation of
significant probes with Lambda equal or
greater Theta, passed to the points function.
rugArgs
Arguments for the representation of the probe
coverage along the genome, passed to the rug function.
regionArgs
Arguments for the representation of
estimated LES, passed to the rect function. If 'col' is
specified as a function it determines the color of each region
depending on its input Lambda (default: gray()).
If 'col' is a vector its elements are used to color the regions
with recycling.
Methods and functions:
Lesestimatethresholdregionscichi2exportplot
Examples
data(spikeInStat)

x <- Les(pos, pval)
x <- estimate(x, 200)
x <- threshold(x)
x <- regions(x)

plot(x, region=TRUE)
Results
R version 3.3.1 (2016-06-21) -- "Bug in Your Hair"
Copyright (C) 2016 The R Foundation for Statistical Computing
Platform: x86_64-pc-linux-gnu (64-bit)

R is free software and comes with ABSOLUTELY NO WARRANTY.
You are welcome to redistribute it under certain conditions.
Type 'license()' or 'licence()' for distribution details.

R is a collaborative project with many contributors.
Type 'contributors()' for more information and
'citation()' on how to cite R or R packages in publications.

Type 'demo()' for some demos, 'help()' for on-line help, or
'help.start()' for an HTML browser interface to help.
Type 'q()' to quit R.

> library(les)
Loading required package: fdrtool
> png(filename="/home/ddbj/snapshot/RGM3/R_BC/result/les/plot.Rd_%03d_medium.png", width=480, height=480)
> ### Name: plot,Les-method
> ### Title: plot method for class Les
> ### Aliases: plot plot-methods plot,Les plot,Les-method
> ### Keywords: utilities methods hplot
>
> ### ** Examples
>
> data(spikeInStat)
>
> x <- Les(pos, pval)
> x <- estimate(x, 200)
> x <- threshold(x)
> x <- regions(x)
>
> plot(x, region=TRUE)
>
>
>
>
>
> dev.off()
null device
          1
>
 .
.