Supported by Dr. Osamu Ogasawara and  . . |
|
Last data update: 2014.03.03 |
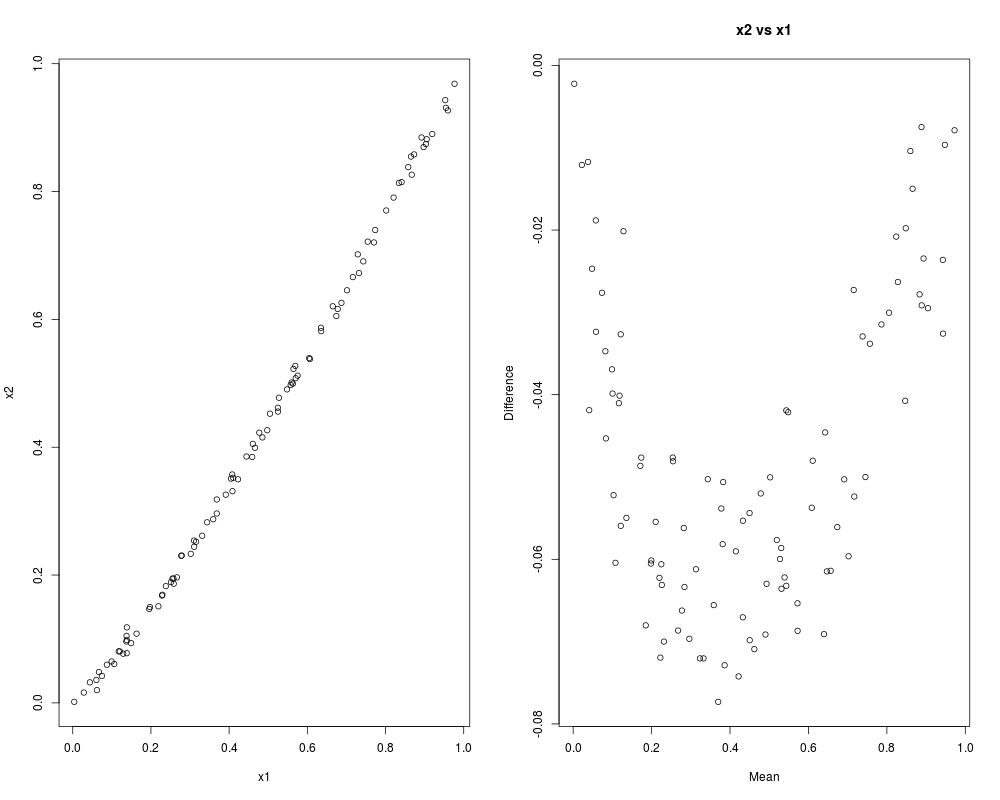
Mean-Difference PlotDescriptionCreates a mean-difference plot of two columns of a matrix. Usagemdplot(x, columns=c(1,2), xlab="Mean", ylab="Difference", main=NULL, ...) Arguments
DetailsPlots differences vs means for a set of bivariate values.
This is a generally useful approach for comparing two correlated measures of the same underlying phenomenon.
Bland and Altman (1986) argue it is more information than a simple scatterplot of the two variables.
The bivariate values are stored as columns of ValueA plot is created on the current graphics device. Author(s)Gordon Smyth ReferencesCleveland, W. S., (1993). Visualizing Data. Hobart Press. Bland, J. M., and Altman, D. G. (1986). Statistical methods for assessing agreement between two methods of clinical measurement. Lancet 327, 307-310. See also http://www.statsci.org/micrarra/refs/maplots.html See Also
An overview of diagnostic functions available in LIMMA is given in 09.Diagnostics. Examplesx1 <- runif(100) x2 <- (x1 + rnorm(100,sd=0.01))^1.2 oldpar <- par(mfrow=c(1,2)) plot(x1,x2) mdplot(cbind(x1,x2),bg.pch=1,bg.cex=1) par(oldpar) Results
R version 3.3.1 (2016-06-21) -- "Bug in Your Hair"
Copyright (C) 2016 The R Foundation for Statistical Computing
Platform: x86_64-pc-linux-gnu (64-bit)

R is free software and comes with ABSOLUTELY NO WARRANTY.
You are welcome to redistribute it under certain conditions.
Type 'license()' or 'licence()' for distribution details.

R is a collaborative project with many contributors.
Type 'contributors()' for more information and
'citation()' on how to cite R or R packages in publications.

Type 'demo()' for some demos, 'help()' for on-line help, or
'help.start()' for an HTML browser interface to help.
Type 'q()' to quit R.

> library(limma)
> png(filename="/home/ddbj/snapshot/RGM3/R_BC/result/limma/mdplot.Rd_%03d_medium.png", width=480, height=480)
> ### Name: mdplot
> ### Title: Mean-Difference Plot
> ### Aliases: mdplot
> ### Keywords: hplot
>
> ### ** Examples
>
> x1 <- runif(100)
> x2 <- (x1 + rnorm(100,sd=0.01))^1.2
> oldpar <- par(mfrow=c(1,2))
> plot(x1,x2)
> mdplot(cbind(x1,x2),bg.pch=1,bg.cex=1)
> par(oldpar)
>
>
>
>
>
> dev.off()
null device
          1
>
|