Supported by Dr. Osamu Ogasawara and  . . |
|
Last data update: 2014.03.03 |
Multidimensional scaling plot of distances between gene expression profilesDescriptionPlot samples on a two-dimensional scatterplot so that distances on the plot approximate the typical log2 fold changes between the samples. Usage
## Default S3 method:
plotMDS(x, top = 500, labels = NULL, pch = NULL, cex = 1,
     dim.plot = c(1,2), ndim = max(dim.plot), gene.selection = "pairwise",
     xlab = NULL, ylab = NULL, ...)
## S3 method for class 'MDS'
plotMDS(x, labels = NULL, pch = NULL, cex = 1, dim.plot = NULL,
     xlab = NULL, ylab = NULL, ...)
Arguments
DetailsThis function is a variation on the usual multdimensional scaling (or principle coordinate) plot, in that a distance measure particularly appropriate for the microarray context is used.
The distance between each pair of samples (columns) is the root-mean-square deviation (Euclidean distance) for the top If See ValueA plot is created on the current graphics device. An object of class
Author(s)Di Wu and Gordon Smyth ReferencesRitchie, ME, Phipson, B, Wu, D, Hu, Y, Law, CW, Shi, W, and Smyth, GK (2015). limma powers differential expression analyses for RNA-sequencing and microarray studies. Nucleic Acids Research 43, e47. http://nar.oxfordjournals.org/content/43/7/e47 See Also
An overview of diagnostic functions available in LIMMA is given in 09.Diagnostics. Examples
# Simulate gene expression data for 1000 probes and 6 microarrays.
# Samples are in two groups
# First 50 probes are differentially expressed in second group
sd <- 0.3*sqrt(4/rchisq(1000,df=4))
x <- matrix(rnorm(1000*6,sd=sd),1000,6)
rownames(x) <- paste("Gene",1:1000)
x[1:50,4:6] <- x[1:50,4:6] + 2
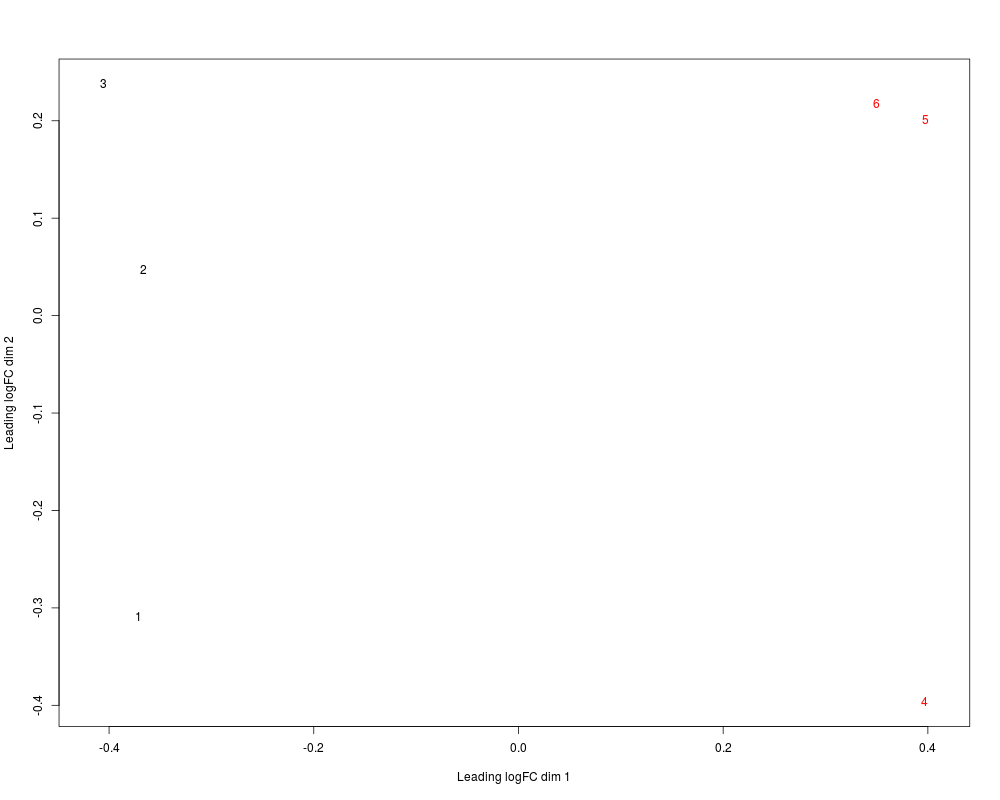
# without labels, indexes of samples are plotted.
mds <- plotMDS(x, col=c(rep("black",3), rep("red",3)) )
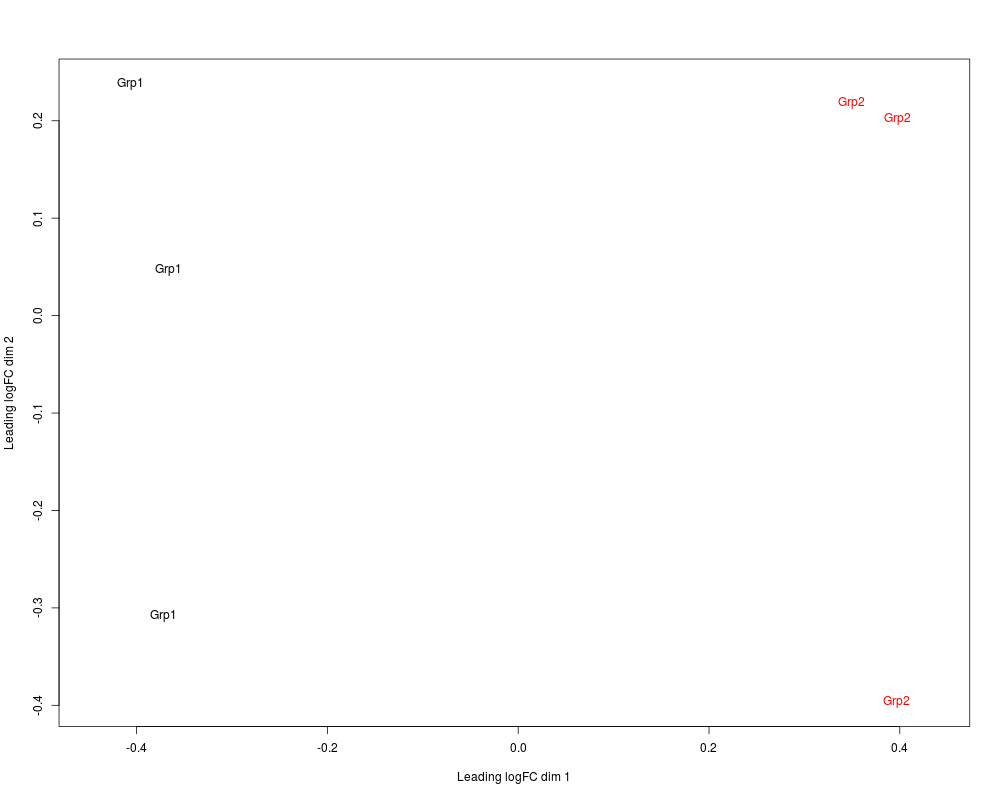
# or labels can be provided, here group indicators:
plotMDS(mds, col=c(rep("black",3), rep("red",3)), labels= c(rep("Grp1",3), rep("Grp2",3)))
Results
R version 3.3.1 (2016-06-21) -- "Bug in Your Hair"
Copyright (C) 2016 The R Foundation for Statistical Computing
Platform: x86_64-pc-linux-gnu (64-bit)

R is free software and comes with ABSOLUTELY NO WARRANTY.
You are welcome to redistribute it under certain conditions.
Type 'license()' or 'licence()' for distribution details.

R is a collaborative project with many contributors.
Type 'contributors()' for more information and
'citation()' on how to cite R or R packages in publications.

Type 'demo()' for some demos, 'help()' for on-line help, or
'help.start()' for an HTML browser interface to help.
Type 'q()' to quit R.

> library(limma)
> png(filename="/home/ddbj/snapshot/RGM3/R_BC/result/limma/plotMDS.Rd_%03d_medium.png", width=480, height=480)
> ### Name: plotMDS
> ### Title: Multidimensional scaling plot of distances between gene
> ###   expression profiles
> ### Aliases: plotMDS plotMDS.MDS plotMDS.default MDS-class show,MDS-method
>
> ### ** Examples
>
> # Simulate gene expression data for 1000 probes and 6 microarrays.
> # Samples are in two groups
> # First 50 probes are differentially expressed in second group
> sd <- 0.3*sqrt(4/rchisq(1000,df=4))
> x <- matrix(rnorm(1000*6,sd=sd),1000,6)
> rownames(x) <- paste("Gene",1:1000)
> x[1:50,4:6] <- x[1:50,4:6] + 2
> # without labels, indexes of samples are plotted.
> mds <- plotMDS(x,  col=c(rep("black",3), rep("red",3)) )
> # or labels can be provided, here group indicators:
> plotMDS(mds,  col=c(rep("black",3), rep("red",3)), labels= c(rep("Grp1",3), rep("Grp2",3)))
>
>
>
>
>
> dev.off()
null device
          1
>
|