Supported by Dr. Osamu Ogasawara and  . . |
|
Last data update: 2014.03.03 |
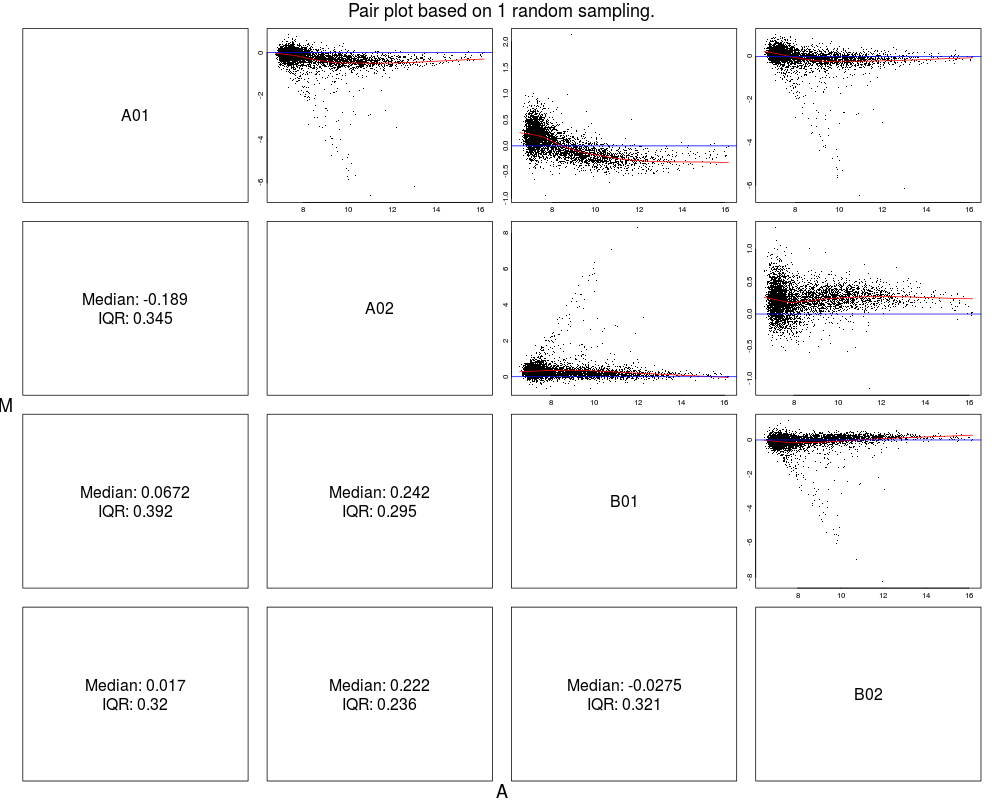
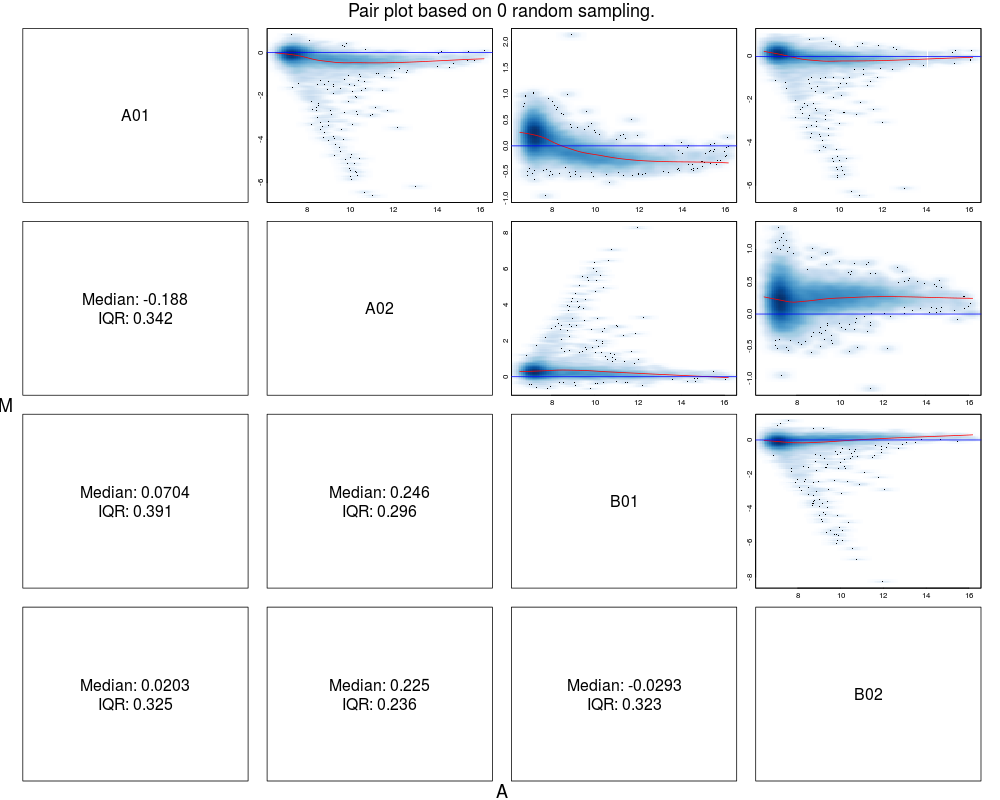
MAplot of a ExpressionSet objectDescriptionCreating pairwise MAplot of sample intensities in a ExpressionSet object Usage## S4 method for signature 'ExpressionSet' MAplot(object, ..., smoothScatter = FALSE, logMode = TRUE, subset = 5000, main = NULL) Arguments
DetailsTo increase the plot efficiency, by default, we only plot RANDOMLY selected subset of points (based on parameter "subset"). If users want to plot all the points, they can set the parameter "subset = NULL". When smoothScatter is set as TRUE, the subsetting will be suppressed because See Also
Examples## load example data data(example.lumi) MAplot(example.lumi) MAplot(example.lumi, smoothScatter=TRUE) Results
R version 3.3.1 (2016-06-21) -- "Bug in Your Hair"
Copyright (C) 2016 The R Foundation for Statistical Computing
Platform: x86_64-pc-linux-gnu (64-bit)

R is free software and comes with ABSOLUTELY NO WARRANTY.
You are welcome to redistribute it under certain conditions.
Type 'license()' or 'licence()' for distribution details.

R is a collaborative project with many contributors.
Type 'contributors()' for more information and
'citation()' on how to cite R or R packages in publications.

Type 'demo()' for some demos, 'help()' for on-line help, or
'help.start()' for an HTML browser interface to help.
Type 'q()' to quit R.

> library(lumi)
Loading required package: Biobase
Loading required package: BiocGenerics
Loading required package: parallel

Attaching package: 'BiocGenerics'

The following objects are masked from 'package:parallel':

    clusterApply, clusterApplyLB, clusterCall, clusterEvalQ,
    clusterExport, clusterMap, parApply, parCapply, parLapply,
    parLapplyLB, parRapply, parSapply, parSapplyLB

The following objects are masked from 'package:stats':

    IQR, mad, xtabs

The following objects are masked from 'package:base':

    Filter, Find, Map, Position, Reduce, anyDuplicated, append,
    as.data.frame, cbind, colnames, do.call, duplicated, eval, evalq,
    get, grep, grepl, intersect, is.unsorted, lapply, lengths, mapply,
    match, mget, order, paste, pmax, pmax.int, pmin, pmin.int, rank,
    rbind, rownames, sapply, setdiff, sort, table, tapply, union,
    unique, unsplit

Welcome to Bioconductor

    Vignettes contain introductory material; view with
    'browseVignettes()'. To cite Bioconductor, see
    'citation("Biobase")', and for packages 'citation("pkgname")'.

Setting options('download.file.method.GEOquery'='auto')
Setting options('GEOquery.inmemory.gpl'=FALSE)
> png(filename="/home/ddbj/snapshot/RGM3/R_BC/result/lumi/MAplot-methods.Rd_%03d_medium.png", width=480, height=480)
> ### Name: MAplot-methods
> ### Title: MAplot of a ExpressionSet object
> ### Aliases: MAplot-methods MAplot MAplot.ExpressionSet
> ###   MAplot,ExpressionSet-method
> ### Keywords: methods hplot
>
> ### ** Examples
>
> ## load example data
> data(example.lumi)
>
> MAplot(example.lumi)
>
> MAplot(example.lumi, smoothScatter=TRUE)
>
>
>
>
>
> dev.off()
null device
          1
>
|
Created & Maintained by Osamu Ogasawara (osamu.ogasawara@gmail.com) and 