subset of rows used to plot. It can be an index vector, or the length of a random subset
xlab
xlab of the plot
ylab
ylab of the plot
...
optional arguments to boxplot.
Details
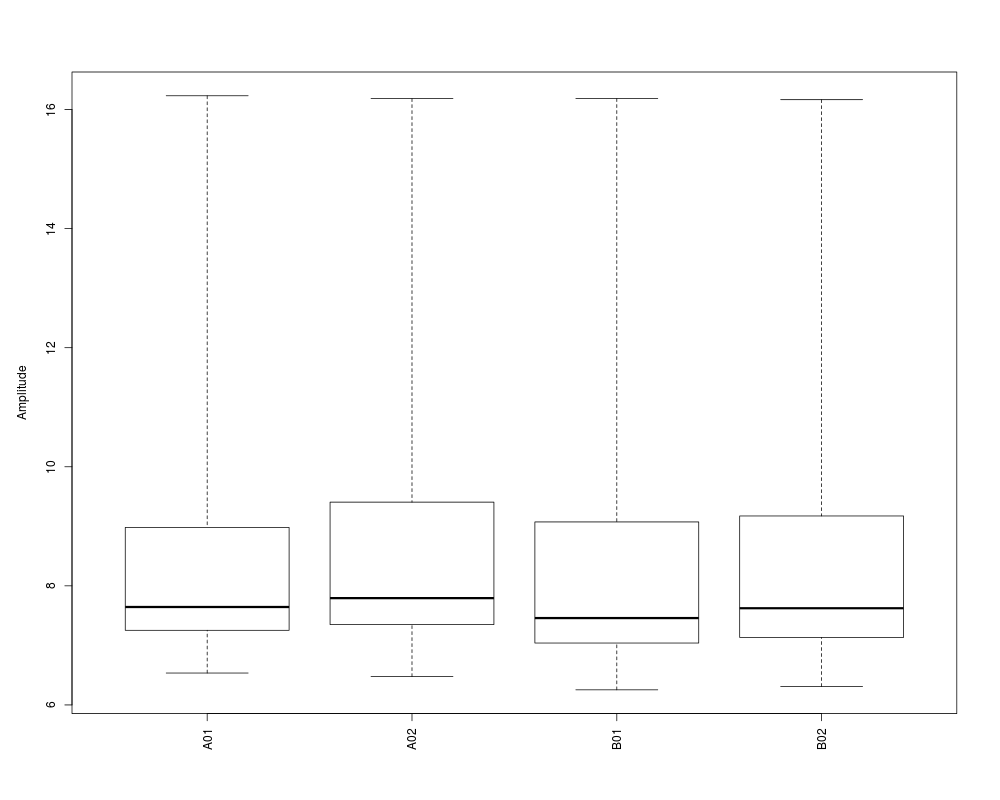
The boxplot function has a "subset" parameter. By default, it is set as 5000, i.e., randomly selected 5000 probes to plot the boxplot. The purpose of this is to plot the picture faster, but it will also make the boxplot has slightly different each time. If the user wants to make sure the boxplot is the same each time, you can set the "subset" parameter as NULL.
See Also
LumiBatch-class, boxplot and boxplot,MethyLumiM-method
Examples
## load example data
data(example.lumi)

boxplot(example.lumi)
Results
R version 3.3.1 (2016-06-21) -- "Bug in Your Hair"
Copyright (C) 2016 The R Foundation for Statistical Computing
Platform: x86_64-pc-linux-gnu (64-bit)

R is free software and comes with ABSOLUTELY NO WARRANTY.
You are welcome to redistribute it under certain conditions.
Type 'license()' or 'licence()' for distribution details.

R is a collaborative project with many contributors.
Type 'contributors()' for more information and
'citation()' on how to cite R or R packages in publications.

Type 'demo()' for some demos, 'help()' for on-line help, or
'help.start()' for an HTML browser interface to help.
Type 'q()' to quit R.

> library(lumi)
Loading required package: Biobase
Loading required package: BiocGenerics
Loading required package: parallel

Attaching package: 'BiocGenerics'

The following objects are masked from 'package:parallel':

    clusterApply, clusterApplyLB, clusterCall, clusterEvalQ,
    clusterExport, clusterMap, parApply, parCapply, parLapply,
    parLapplyLB, parRapply, parSapply, parSapplyLB

The following objects are masked from 'package:stats':

    IQR, mad, xtabs

The following objects are masked from 'package:base':

    Filter, Find, Map, Position, Reduce, anyDuplicated, append,
    as.data.frame, cbind, colnames, do.call, duplicated, eval, evalq,
    get, grep, grepl, intersect, is.unsorted, lapply, lengths, mapply,
    match, mget, order, paste, pmax, pmax.int, pmin, pmin.int, rank,
    rbind, rownames, sapply, setdiff, sort, table, tapply, union,
    unique, unsplit

Welcome to Bioconductor

    Vignettes contain introductory material; view with
    'browseVignettes()'. To cite Bioconductor, see
    'citation("Biobase")', and for packages 'citation("pkgname")'.

Setting options('download.file.method.GEOquery'='auto')
Setting options('GEOquery.inmemory.gpl'=FALSE)
> png(filename="/home/ddbj/snapshot/RGM3/R_BC/result/lumi/boxplot-methods.Rd_%03d_medium.png", width=480, height=480)
> ### Name: boxplot-methods
> ### Title: boxplot of a ExpressionSet object
> ### Aliases: boxplot-methods boxplot.ExpressionSet
> ###   boxplot,ExpressionSet-method
> ### Keywords: methods hplot
>
> ### ** Examples
>
> ## load example data
> data(example.lumi)
>
> boxplot(example.lumi)
>
>
>
>
>
> dev.off()
null device
          1
>
 .
.