Supported by Dr. Osamu Ogasawara and  . . |
|
Last data update: 2014.03.03 |
Detect the outlier sample (or gene)DescriptionDetect the outlier sample (or gene) based on distance to the cluster center UsagedetectOutlier(x, metric = "euclidean", standardize = TRUE, Th = 2, ifPlot = FALSE) Arguments
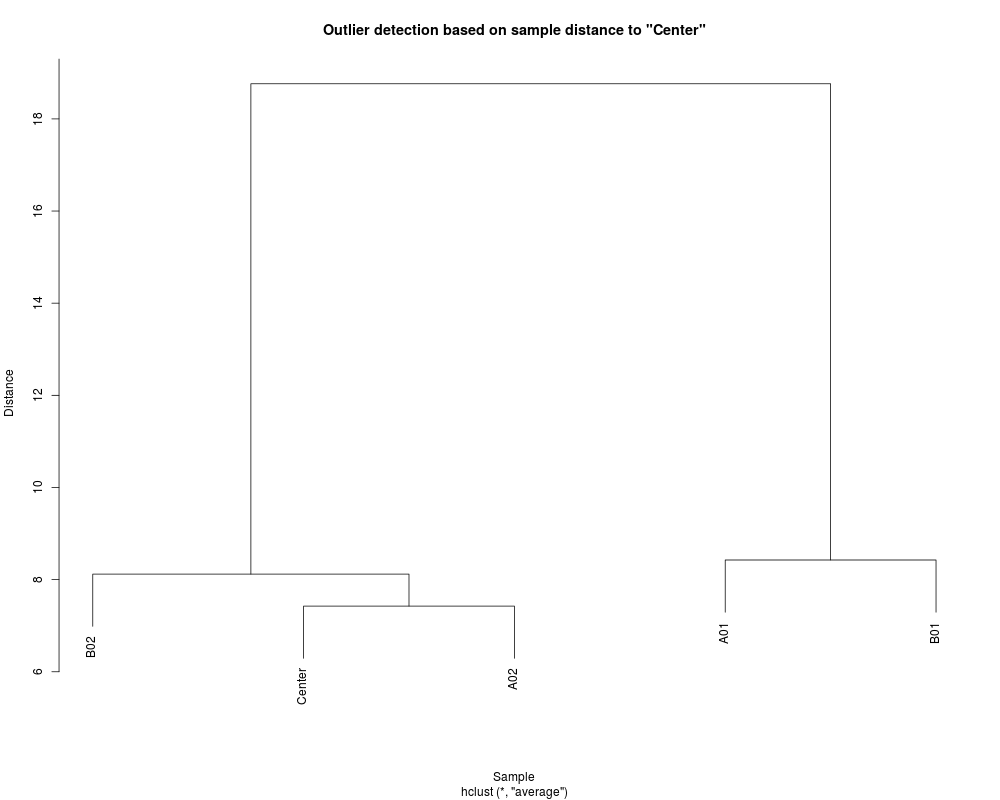
DetailsThe current outlier detection is based on the distance from the sample to the center (average of all samples after removing 10 percent samples farthest away from the center). The assumption of the outlier detection is that there is only one single cluster and the distance from the sample to the center is Gaussian distributed. The outlier is detected when its distance to the center is larger than a certain threshold. The threshold is calculated as Th * median distances to the center. The profile relations can be visualized as a hierarchical tree. ValuePlot the results or return the outlier (a logic vector) with the distance matrix and threshold as attributes. Author(s)Pan Du See Also
Examples## load example data data(example.lumi) ## detect the outlier (Further improvement needed.) temp <- detectOutlier(example.lumi, ifPlot=TRUE) Results
R version 3.3.1 (2016-06-21) -- "Bug in Your Hair"
Copyright (C) 2016 The R Foundation for Statistical Computing
Platform: x86_64-pc-linux-gnu (64-bit)

R is free software and comes with ABSOLUTELY NO WARRANTY.
You are welcome to redistribute it under certain conditions.
Type 'license()' or 'licence()' for distribution details.

R is a collaborative project with many contributors.
Type 'contributors()' for more information and
'citation()' on how to cite R or R packages in publications.

Type 'demo()' for some demos, 'help()' for on-line help, or
'help.start()' for an HTML browser interface to help.
Type 'q()' to quit R.

> library(lumi)
Loading required package: Biobase
Loading required package: BiocGenerics
Loading required package: parallel

Attaching package: 'BiocGenerics'

The following objects are masked from 'package:parallel':

    clusterApply, clusterApplyLB, clusterCall, clusterEvalQ,
    clusterExport, clusterMap, parApply, parCapply, parLapply,
    parLapplyLB, parRapply, parSapply, parSapplyLB

The following objects are masked from 'package:stats':

    IQR, mad, xtabs

The following objects are masked from 'package:base':

    Filter, Find, Map, Position, Reduce, anyDuplicated, append,
    as.data.frame, cbind, colnames, do.call, duplicated, eval, evalq,
    get, grep, grepl, intersect, is.unsorted, lapply, lengths, mapply,
    match, mget, order, paste, pmax, pmax.int, pmin, pmin.int, rank,
    rbind, rownames, sapply, setdiff, sort, table, tapply, union,
    unique, unsplit

Welcome to Bioconductor

    Vignettes contain introductory material; view with
    'browseVignettes()'. To cite Bioconductor, see
    'citation("Biobase")', and for packages 'citation("pkgname")'.

Setting options('download.file.method.GEOquery'='auto')
Setting options('GEOquery.inmemory.gpl'=FALSE)
> png(filename="/home/ddbj/snapshot/RGM3/R_BC/result/lumi/detectOutlier.Rd_%03d_medium.png", width=480, height=480)
> ### Name: detectOutlier
> ### Title: Detect the outlier sample (or gene)
> ### Aliases: detectOutlier
> ### Keywords: methods
>
> ### ** Examples
>
> ## load example data
> data(example.lumi)
>
> ## detect the outlier (Further improvement needed.)
> temp <- detectOutlier(example.lumi, ifPlot=TRUE)
>
>
>
>
>
>
> dev.off()
null device
          1
>
|