Supported by Dr. Osamu Ogasawara and  . . |
|
Last data update: 2014.03.03 |
Estimate methylation M-value matrixDescriptionEstimate methylation M-value matrix from MethyLumiM-class object or eSet-class object, which include methylated and unmethylated probe intensities Usage
estimateM(methyLumiM, returnType=c("ExpressionSet", "matrix"), offset=100)
Arguments
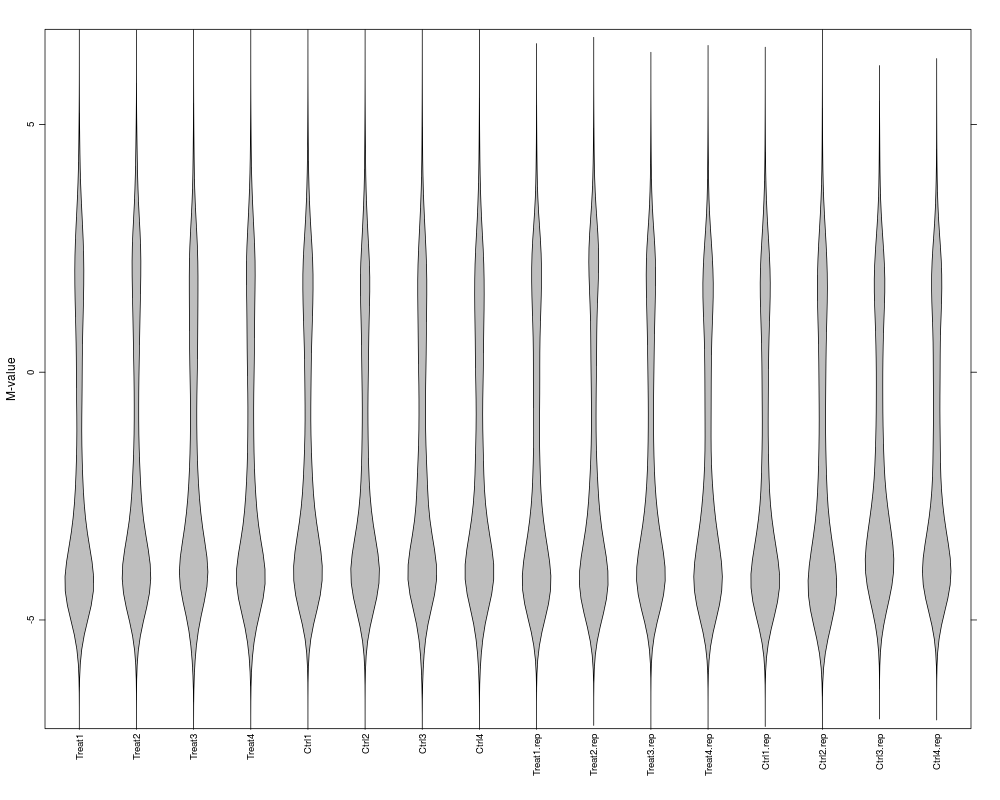
DetailsM-value is the log2 ratio between Illumina methylated and unmethylated probe intensities. As variations of small intensities can cause big changes in the ratio estimation, so an offset is added to methylated and unmethylated probe intensities when estimating the M-value. ValueA MethyLumiM or matrix object of methylation M-value Author(s)Pan DU ReferencesDu, P., Zhang, X, Huang, C.C., Jafari, N., Kibbe, W.A., Hou, L., and Lin, S.M., (2010) 'Comparison of Beta-value and M-value methods for quantifying methylation levels by microarray analysis', (under review) See AlsoSee Also as Examplesdata(example.lumiMethy) methyLumiM = estimateM(example.lumiMethy) boxplot(methyLumiM) Results
R version 3.3.1 (2016-06-21) -- "Bug in Your Hair"
Copyright (C) 2016 The R Foundation for Statistical Computing
Platform: x86_64-pc-linux-gnu (64-bit)

R is free software and comes with ABSOLUTELY NO WARRANTY.
You are welcome to redistribute it under certain conditions.
Type 'license()' or 'licence()' for distribution details.

R is a collaborative project with many contributors.
Type 'contributors()' for more information and
'citation()' on how to cite R or R packages in publications.

Type 'demo()' for some demos, 'help()' for on-line help, or
'help.start()' for an HTML browser interface to help.
Type 'q()' to quit R.

> library(lumi)
Loading required package: Biobase
Loading required package: BiocGenerics
Loading required package: parallel

Attaching package: 'BiocGenerics'

The following objects are masked from 'package:parallel':

    clusterApply, clusterApplyLB, clusterCall, clusterEvalQ,
    clusterExport, clusterMap, parApply, parCapply, parLapply,
    parLapplyLB, parRapply, parSapply, parSapplyLB

The following objects are masked from 'package:stats':

    IQR, mad, xtabs

The following objects are masked from 'package:base':

    Filter, Find, Map, Position, Reduce, anyDuplicated, append,
    as.data.frame, cbind, colnames, do.call, duplicated, eval, evalq,
    get, grep, grepl, intersect, is.unsorted, lapply, lengths, mapply,
    match, mget, order, paste, pmax, pmax.int, pmin, pmin.int, rank,
    rbind, rownames, sapply, setdiff, sort, table, tapply, union,
    unique, unsplit

Welcome to Bioconductor

    Vignettes contain introductory material; view with
    'browseVignettes()'. To cite Bioconductor, see
    'citation("Biobase")', and for packages 'citation("pkgname")'.

Setting options('download.file.method.GEOquery'='auto')
Setting options('GEOquery.inmemory.gpl'=FALSE)
> png(filename="/home/ddbj/snapshot/RGM3/R_BC/result/lumi/estimateM.Rd_%03d_medium.png", width=480, height=480)
> ### Name: estimateM
> ### Title: Estimate methylation M-value matrix
> ### Aliases: estimateM
> ### Keywords: methods
>
> ### ** Examples
>
> data(example.lumiMethy)
> methyLumiM = estimateM(example.lumiMethy)
> boxplot(methyLumiM)
>
>
>
>
>
>
> dev.off()
null device
          1
>
|