subset of rows used to plot. It can be an index vector, or the length of a random subset
fold
The fold-change threshold used to estimate the number of probes having high fold-changes
dotColor
color of points in the scatter plot
highlight
the subset dots need to be highlighted
highlightColor
the color for those highlighted dots
main
title of the plot
checkTransform
whether to check the data is log2-transformed or not
Details
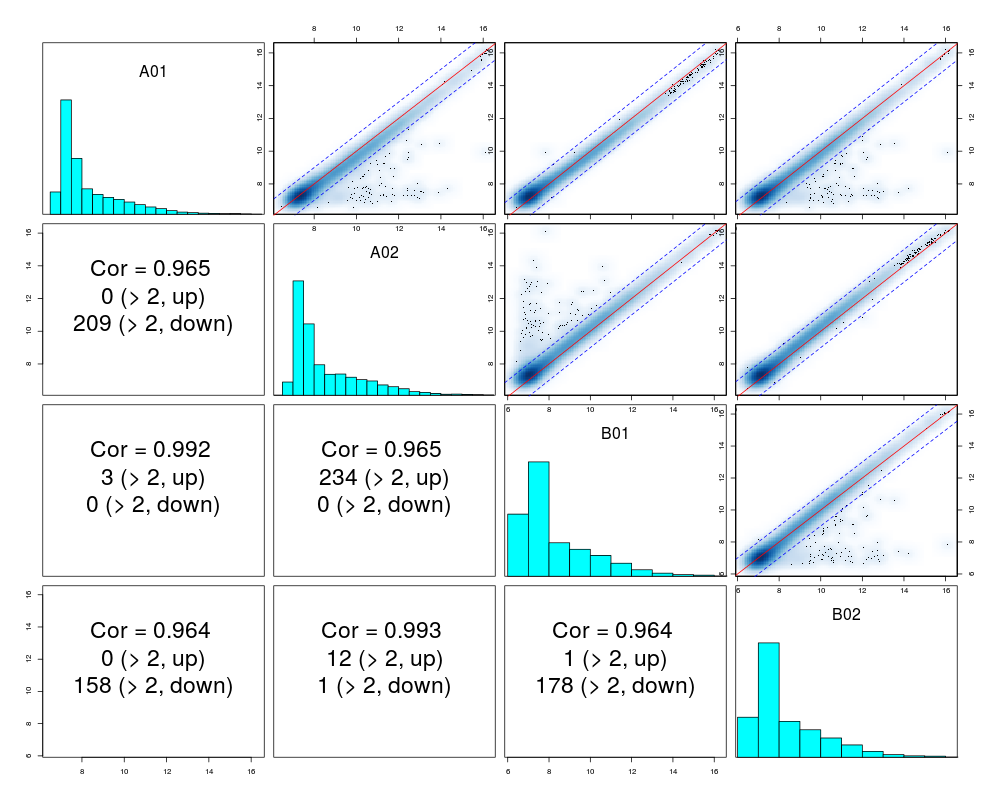
To increase the plot efficiency, by default, we only plot RANDOMLY selected subset of points (based on parameter "subset"). If users want to plot all the points, they can set the parameter "subset = NULL". When smoothScatter is set as TRUE, the subsetting will be suppressed because smoothScatter function has good plot efficiency for large number of points.
See Also
LumiBatch-class, pairs
Examples
## load example data
data(example.lumi)
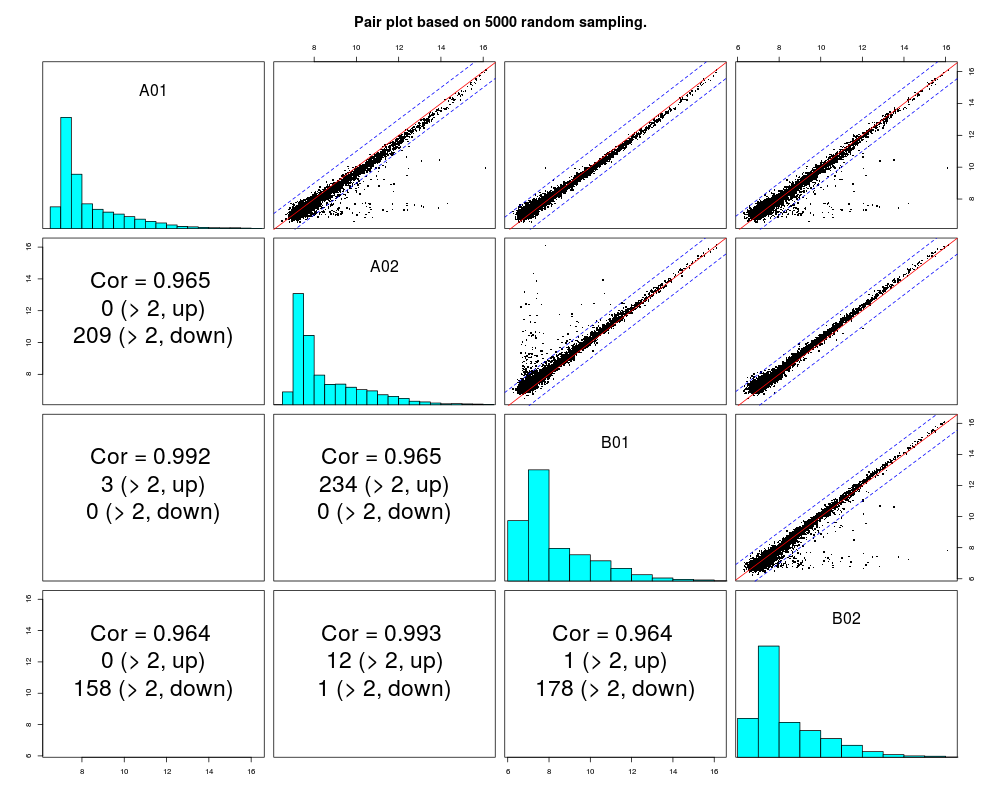
pairs(example.lumi)
pairs(example.lumi, smoothScatter=TRUE)
Results
R version 3.3.1 (2016-06-21) -- "Bug in Your Hair"
Copyright (C) 2016 The R Foundation for Statistical Computing
Platform: x86_64-pc-linux-gnu (64-bit)

R is free software and comes with ABSOLUTELY NO WARRANTY.
You are welcome to redistribute it under certain conditions.
Type 'license()' or 'licence()' for distribution details.

R is a collaborative project with many contributors.
Type 'contributors()' for more information and
'citation()' on how to cite R or R packages in publications.

Type 'demo()' for some demos, 'help()' for on-line help, or
'help.start()' for an HTML browser interface to help.
Type 'q()' to quit R.

> library(lumi)
Loading required package: Biobase
Loading required package: BiocGenerics
Loading required package: parallel

Attaching package: 'BiocGenerics'

The following objects are masked from 'package:parallel':

    clusterApply, clusterApplyLB, clusterCall, clusterEvalQ,
    clusterExport, clusterMap, parApply, parCapply, parLapply,
    parLapplyLB, parRapply, parSapply, parSapplyLB

The following objects are masked from 'package:stats':

    IQR, mad, xtabs

The following objects are masked from 'package:base':

    Filter, Find, Map, Position, Reduce, anyDuplicated, append,
    as.data.frame, cbind, colnames, do.call, duplicated, eval, evalq,
    get, grep, grepl, intersect, is.unsorted, lapply, lengths, mapply,
    match, mget, order, paste, pmax, pmax.int, pmin, pmin.int, rank,
    rbind, rownames, sapply, setdiff, sort, table, tapply, union,
    unique, unsplit

Welcome to Bioconductor

    Vignettes contain introductory material; view with
    'browseVignettes()'. To cite Bioconductor, see
    'citation("Biobase")', and for packages 'citation("pkgname")'.

Setting options('download.file.method.GEOquery'='auto')
Setting options('GEOquery.inmemory.gpl'=FALSE)
> png(filename="/home/ddbj/snapshot/RGM3/R_BC/result/lumi/pairs-methods.Rd_%03d_medium.png", width=480, height=480)
> ### Name: pairs-methods
> ### Title: Pair plot of an ExpressionSet object
> ### Aliases: pairs-methods pairs.ExpressionSet pairs,ExpressionSet-method
> ### Keywords: methods hplot
>
> ### ** Examples
>
> ## load example data
> data(example.lumi)
>
> pairs(example.lumi)
>
> pairs(example.lumi, smoothScatter=TRUE)
>
>
>
>
>
> dev.off()
null device
          1
>
 .
.