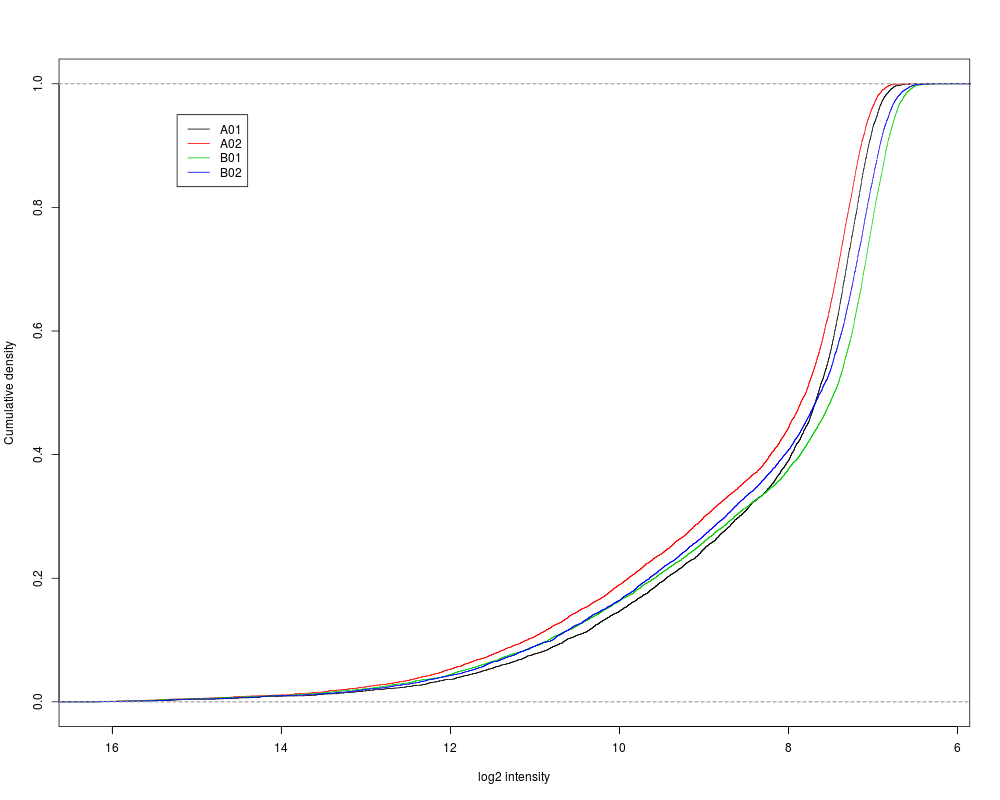
determine whether plot the CDF from high to low value or not
logMode
determine whether the CDF plot is based on a log2 scale
xlab
xlab of the plotCDF plot
ylab
ylab of the plotCDF plot
col
line colors of the plotCDF plot
lwd
line width of plot function
xlim
parameter of the plot function
index.highlight
the column index of the highlighted plotCDF curve
color.highlight
color of highlighted plotCDF curve
addLegend
whether add legend to the plot or not
main
title for the plot
...
additional parameters for plot.ecdf function
See Also
LumiBatch-class, ecdf
Examples
## load example data
data(example.lumi)

plotCDF(example.lumi)
Results
R version 3.3.1 (2016-06-21) -- "Bug in Your Hair"
Copyright (C) 2016 The R Foundation for Statistical Computing
Platform: x86_64-pc-linux-gnu (64-bit)

R is free software and comes with ABSOLUTELY NO WARRANTY.
You are welcome to redistribute it under certain conditions.
Type 'license()' or 'licence()' for distribution details.

R is a collaborative project with many contributors.
Type 'contributors()' for more information and
'citation()' on how to cite R or R packages in publications.

Type 'demo()' for some demos, 'help()' for on-line help, or
'help.start()' for an HTML browser interface to help.
Type 'q()' to quit R.

> library(lumi)
Loading required package: Biobase
Loading required package: BiocGenerics
Loading required package: parallel

Attaching package: 'BiocGenerics'

The following objects are masked from 'package:parallel':

    clusterApply, clusterApplyLB, clusterCall, clusterEvalQ,
    clusterExport, clusterMap, parApply, parCapply, parLapply,
    parLapplyLB, parRapply, parSapply, parSapplyLB

The following objects are masked from 'package:stats':

    IQR, mad, xtabs

The following objects are masked from 'package:base':

    Filter, Find, Map, Position, Reduce, anyDuplicated, append,
    as.data.frame, cbind, colnames, do.call, duplicated, eval, evalq,
    get, grep, grepl, intersect, is.unsorted, lapply, lengths, mapply,
    match, mget, order, paste, pmax, pmax.int, pmin, pmin.int, rank,
    rbind, rownames, sapply, setdiff, sort, table, tapply, union,
    unique, unsplit

Welcome to Bioconductor

    Vignettes contain introductory material; view with
    'browseVignettes()'. To cite Bioconductor, see
    'citation("Biobase")', and for packages 'citation("pkgname")'.

Setting options('download.file.method.GEOquery'='auto')
Setting options('GEOquery.inmemory.gpl'=FALSE)
> png(filename="/home/ddbj/snapshot/RGM3/R_BC/result/lumi/plotCDF.Rd_%03d_medium.png", width=480, height=480)
> ### Name: plotCDF
> ### Title: plot the cumulative distribution function of a ExpressionSet
> ###   object
> ### Aliases: plotCDF plotCDF.ExpressionSet plotCDF,ExpressionSet-method
> ### Keywords: methods hplot
>
> ### ** Examples
>
> ## load example data
> data(example.lumi)
>
> plotCDF(example.lumi)
>
>
>
>
>
> dev.off()
null device
          1
>
 .
.