Supported by Dr. Osamu Ogasawara and  . . |
|
Last data update: 2014.03.03 |
Plot the color bias density plot of Illumina Infinium Methylation dataDescriptionPlot the color bias density plot of Illumina Infinium Methylation data in one dimension (comparing with 2D scatter plot) Usage
plotColorBias1D(methyLumiM, channel = c("both", "unmethy", "methy", "sum"), colorMode=TRUE, removeGenderProbes = FALSE, logMode = TRUE, subset = NULL, ...)
Arguments
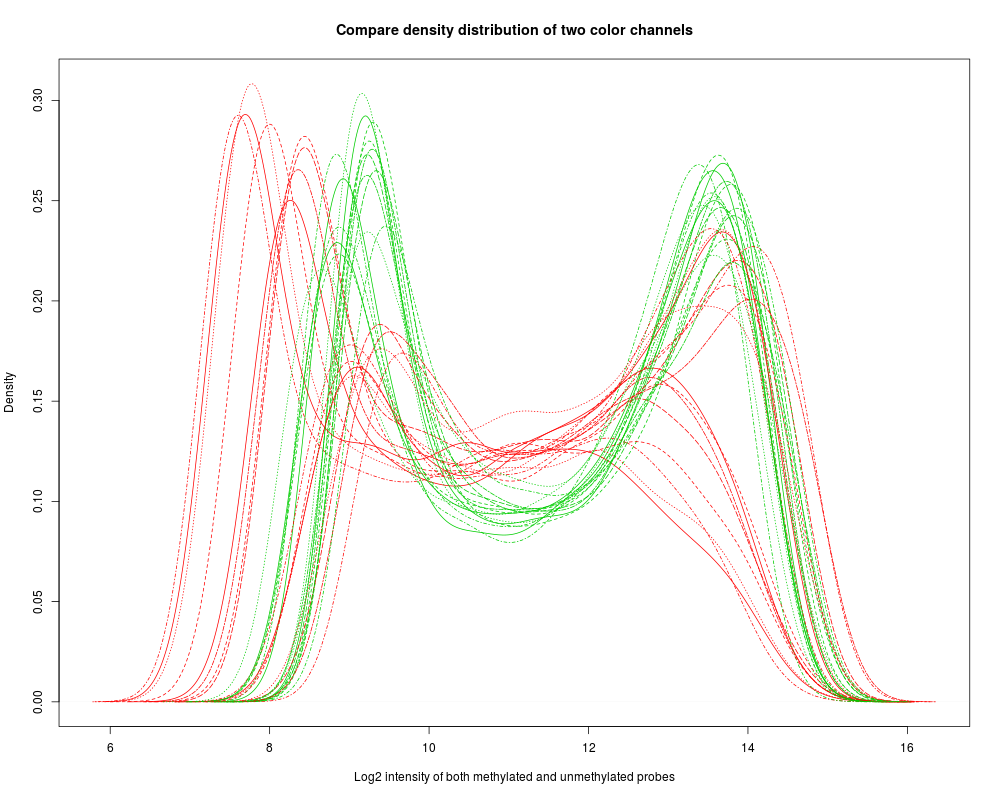
DetailsPlot the color bias density plot of Illumina Infinium Methylation data. There are four options using "channel" parameter to plot the density plot. "both": estimate the density by pooling together methylated and unmethylated probe intensities. "unmethy" and "methy": plot either unmethylated or methylated probe density. "sum" plot the density of the sum of methylatled and unmethylated probe intensitys. ValueInvisibly return TRUE if plot successfully. Author(s)Pan DU See AlsoSee Also as Examplesdata(example.lumiMethy) # before adjustment plotColorBias1D(example.lumiMethy) Results
R version 3.3.1 (2016-06-21) -- "Bug in Your Hair"
Copyright (C) 2016 The R Foundation for Statistical Computing
Platform: x86_64-pc-linux-gnu (64-bit)

R is free software and comes with ABSOLUTELY NO WARRANTY.
You are welcome to redistribute it under certain conditions.
Type 'license()' or 'licence()' for distribution details.

R is a collaborative project with many contributors.
Type 'contributors()' for more information and
'citation()' on how to cite R or R packages in publications.

Type 'demo()' for some demos, 'help()' for on-line help, or
'help.start()' for an HTML browser interface to help.
Type 'q()' to quit R.

> library(lumi)
Loading required package: Biobase
Loading required package: BiocGenerics
Loading required package: parallel

Attaching package: 'BiocGenerics'

The following objects are masked from 'package:parallel':

    clusterApply, clusterApplyLB, clusterCall, clusterEvalQ,
    clusterExport, clusterMap, parApply, parCapply, parLapply,
    parLapplyLB, parRapply, parSapply, parSapplyLB

The following objects are masked from 'package:stats':

    IQR, mad, xtabs

The following objects are masked from 'package:base':

    Filter, Find, Map, Position, Reduce, anyDuplicated, append,
    as.data.frame, cbind, colnames, do.call, duplicated, eval, evalq,
    get, grep, grepl, intersect, is.unsorted, lapply, lengths, mapply,
    match, mget, order, paste, pmax, pmax.int, pmin, pmin.int, rank,
    rbind, rownames, sapply, setdiff, sort, table, tapply, union,
    unique, unsplit

Welcome to Bioconductor

    Vignettes contain introductory material; view with
    'browseVignettes()'. To cite Bioconductor, see
    'citation("Biobase")', and for packages 'citation("pkgname")'.

Setting options('download.file.method.GEOquery'='auto')
Setting options('GEOquery.inmemory.gpl'=FALSE)
> png(filename="/home/ddbj/snapshot/RGM3/R_BC/result/lumi/plotColorBias1D.Rd_%03d_medium.png", width=480, height=480)
> ### Name: plotColorBias1D
> ### Title: Plot the color bias density plot of Illumina Infinium
> ###   Methylation data
> ### Aliases: plotColorBias1D
> ### Keywords: methods hplot
>
> ### ** Examples
>
> data(example.lumiMethy)
> # before adjustment
> plotColorBias1D(example.lumiMethy)
>
>
>
>
>
> dev.off()
null device
          1
>
|