Supported by Dr. Osamu Ogasawara and  . . |
|
Last data update: 2014.03.03 |
Plot the color bias of Illumina Infinium Methylation data in two dimensionsDescriptionPlot the color bias (red and green channel) of Illumina Infinium Methylation data of one selected sample in two dimensions (methylated and unmethylated probe intensities) UsageplotColorBias2D(methyLumiM, selSample = 1, combineMode = F, layoutRatioWidth = c(0.75, 0.25), layoutRatioHeight = c(0.25, 0.75), margins = c(5, 5, 2, 2), cex = 1.25, logMode = TRUE, subset = NULL, ...) Arguments
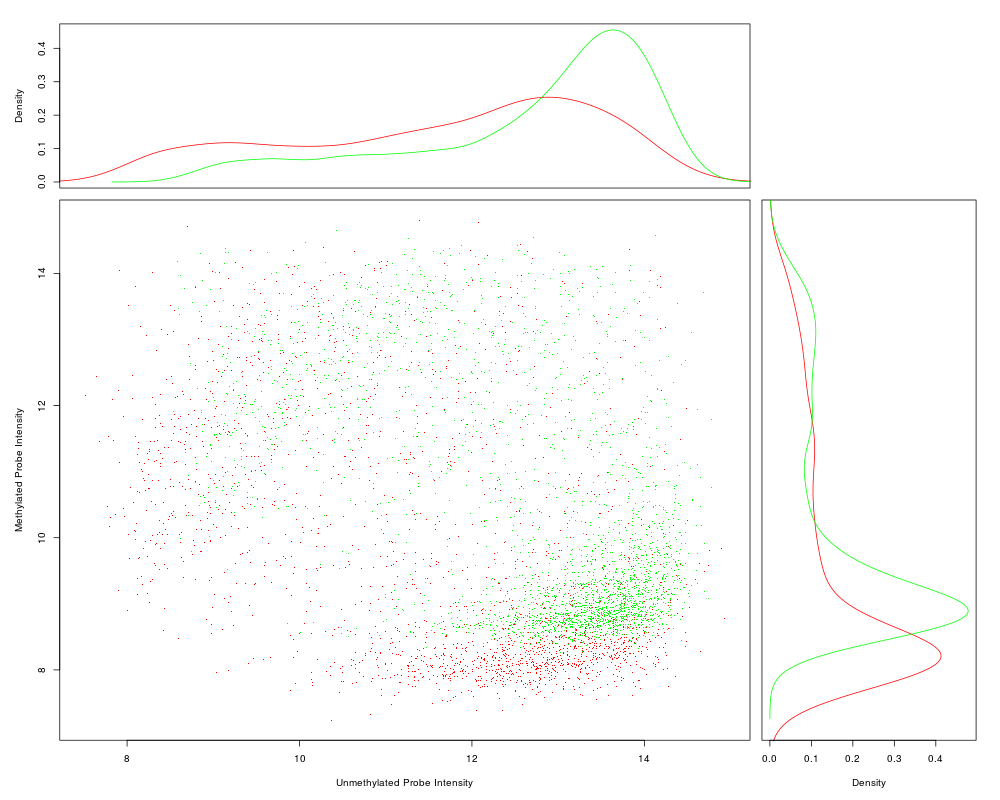
DetailsThe function basically plots the probe intensities in 2-dimension (methylated vs unmethylated), and colors the dots in Red and Green based on their color channel information. The related density plot will also be plotted at the right and top of the scatter plot. ValueInvisibly return TRUE if plot successfully. Author(s)Pan DU See AlsoSee Also as Examplesdata(example.lumiMethy) # plot in 2D plot of one selected sample plotColorBias2D(example.lumiMethy, selSample = 1) Results
R version 3.3.1 (2016-06-21) -- "Bug in Your Hair"
Copyright (C) 2016 The R Foundation for Statistical Computing
Platform: x86_64-pc-linux-gnu (64-bit)

R is free software and comes with ABSOLUTELY NO WARRANTY.
You are welcome to redistribute it under certain conditions.
Type 'license()' or 'licence()' for distribution details.

R is a collaborative project with many contributors.
Type 'contributors()' for more information and
'citation()' on how to cite R or R packages in publications.

Type 'demo()' for some demos, 'help()' for on-line help, or
'help.start()' for an HTML browser interface to help.
Type 'q()' to quit R.

> library(lumi)
Loading required package: Biobase
Loading required package: BiocGenerics
Loading required package: parallel

Attaching package: 'BiocGenerics'

The following objects are masked from 'package:parallel':

    clusterApply, clusterApplyLB, clusterCall, clusterEvalQ,
    clusterExport, clusterMap, parApply, parCapply, parLapply,
    parLapplyLB, parRapply, parSapply, parSapplyLB

The following objects are masked from 'package:stats':

    IQR, mad, xtabs

The following objects are masked from 'package:base':

    Filter, Find, Map, Position, Reduce, anyDuplicated, append,
    as.data.frame, cbind, colnames, do.call, duplicated, eval, evalq,
    get, grep, grepl, intersect, is.unsorted, lapply, lengths, mapply,
    match, mget, order, paste, pmax, pmax.int, pmin, pmin.int, rank,
    rbind, rownames, sapply, setdiff, sort, table, tapply, union,
    unique, unsplit

Welcome to Bioconductor

    Vignettes contain introductory material; view with
    'browseVignettes()'. To cite Bioconductor, see
    'citation("Biobase")', and for packages 'citation("pkgname")'.

Setting options('download.file.method.GEOquery'='auto')
Setting options('GEOquery.inmemory.gpl'=FALSE)
> png(filename="/home/ddbj/snapshot/RGM3/R_BC/result/lumi/plotColorBias2D.Rd_%03d_medium.png", width=480, height=480)
> ### Name: plotColorBias2D
> ### Title: Plot the color bias of Illumina Infinium Methylation data in two
> ###   dimensions
> ### Aliases: plotColorBias2D
> ### Keywords: methods hplot
>
> ### ** Examples
>
> data(example.lumiMethy)
> # plot in 2D plot of one selected sample
> plotColorBias2D(example.lumiMethy, selSample = 1)
>
>
>
>
>
> dev.off()
null device
          1
>
|