Supported by Dr. Osamu Ogasawara and  . . |
|
Last data update: 2014.03.03 |
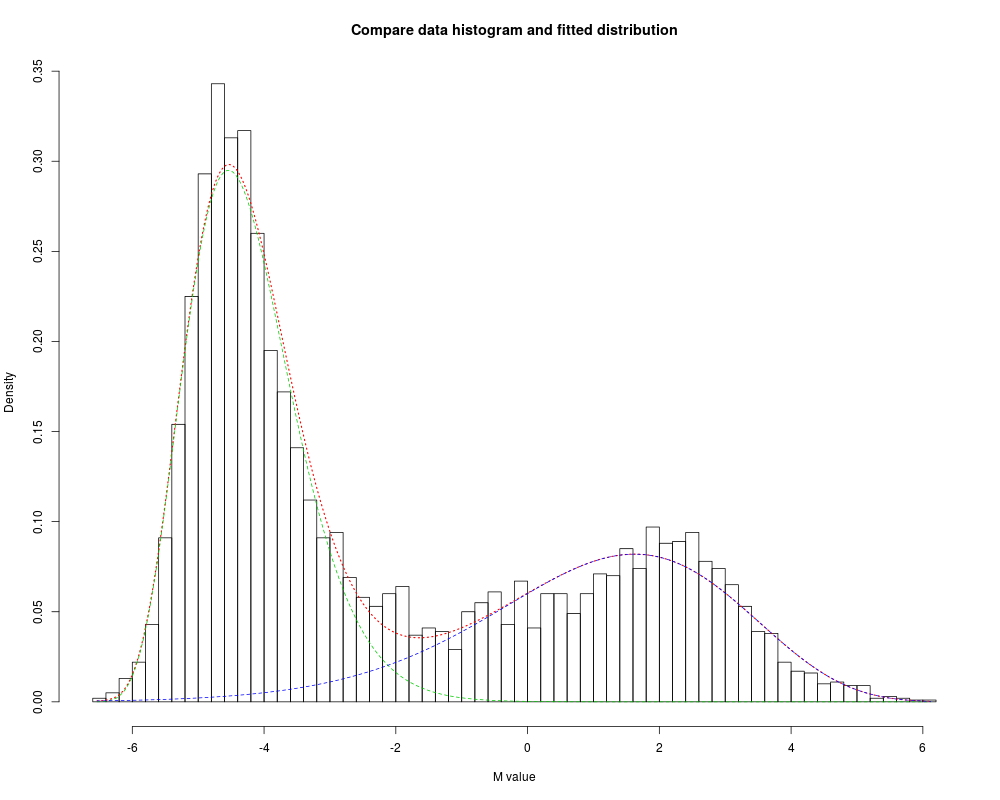
plot the fitting results of
|
x |
a vector of M-values covering the whole genome |
gammaFit |
a "gammaFit" class object returned by |
k |
parameter k of gamma distribution |
theta |
parameter theta of gamma distribution |
shift |
parameter shift of gamma distribution |
proportion |
the proportion of two components (gamma distributions) |
plotType |
determine the way to show the distribution of the input data, either histogram or density plot |
... |
Other parameters used by |
Details
This function is to visualize the fitting results, which helps us understand how well the fitting is.
Value
Invisibly return TRUE if the plot is successful.
Author(s)
Pan DU
See Also
gammaFitEM
Examples
data(example.lumiMethy)
M <- exprs(example.lumiMethy)
fittedGamma <- gammaFitEM(M[,1], initialFit=NULL, maxIteration=50, tol=0.0001, plotMode=FALSE, verbose=FALSE)
plotGammaFit(M[,1], gammaFit=fittedGamma)
Results
R version 3.3.1 (2016-06-21) -- "Bug in Your Hair"
Copyright (C) 2016 The R Foundation for Statistical Computing
Platform: x86_64-pc-linux-gnu (64-bit)

R is free software and comes with ABSOLUTELY NO WARRANTY.
You are welcome to redistribute it under certain conditions.
Type 'license()' or 'licence()' for distribution details.

R is a collaborative project with many contributors.
Type 'contributors()' for more information and
'citation()' on how to cite R or R packages in publications.

Type 'demo()' for some demos, 'help()' for on-line help, or
'help.start()' for an HTML browser interface to help.
Type 'q()' to quit R.

> library(lumi)
Loading required package: Biobase
Loading required package: BiocGenerics
Loading required package: parallel

Attaching package: 'BiocGenerics'

The following objects are masked from 'package:parallel':

    clusterApply, clusterApplyLB, clusterCall, clusterEvalQ,
    clusterExport, clusterMap, parApply, parCapply, parLapply,
    parLapplyLB, parRapply, parSapply, parSapplyLB

The following objects are masked from 'package:stats':

    IQR, mad, xtabs

The following objects are masked from 'package:base':

    Filter, Find, Map, Position, Reduce, anyDuplicated, append,
    as.data.frame, cbind, colnames, do.call, duplicated, eval, evalq,
    get, grep, grepl, intersect, is.unsorted, lapply, lengths, mapply,
    match, mget, order, paste, pmax, pmax.int, pmin, pmin.int, rank,
    rbind, rownames, sapply, setdiff, sort, table, tapply, union,
    unique, unsplit

Welcome to Bioconductor

    Vignettes contain introductory material; view with
    'browseVignettes()'. To cite Bioconductor, see
    'citation("Biobase")', and for packages 'citation("pkgname")'.

Setting options('download.file.method.GEOquery'='auto')
Setting options('GEOquery.inmemory.gpl'=FALSE)
> png(filename="/home/ddbj/snapshot/RGM3/R_BC/result/lumi/plotGammaFit.Rd_%03d_medium.png", width=480, height=480)
> ### Name: plotGammaFit
> ### Title: plot the fitting results of 'gammaFitEM'
> ### Aliases: plotGammaFit
> ### Keywords: methods
>
> ### ** Examples
>
>
> data(example.lumiMethy)
> M <- exprs(example.lumiMethy)
> fittedGamma <- gammaFitEM(M[,1], initialFit=NULL, maxIteration=50, tol=0.0001, plotMode=FALSE, verbose=FALSE)
> plotGammaFit(M[,1], gammaFit=fittedGamma)
>
>
>
>
>
>
> dev.off()
null device
          1
>
|