Supported by Dr. Osamu Ogasawara and  . . |
|
Last data update: 2014.03.03 |
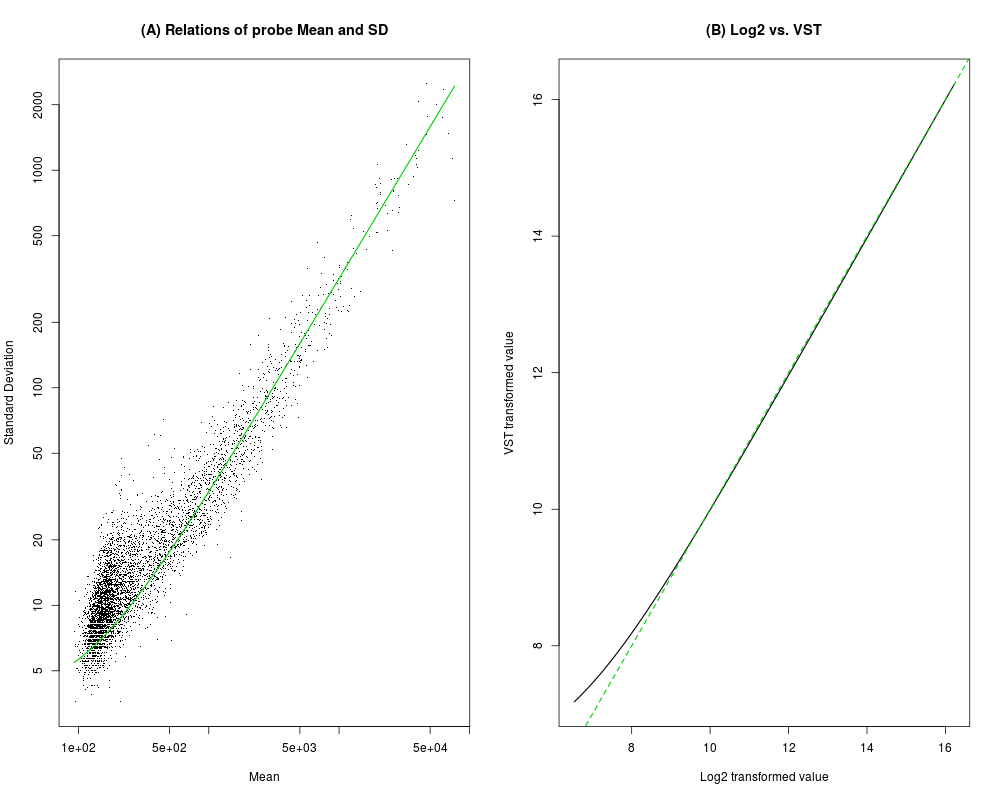
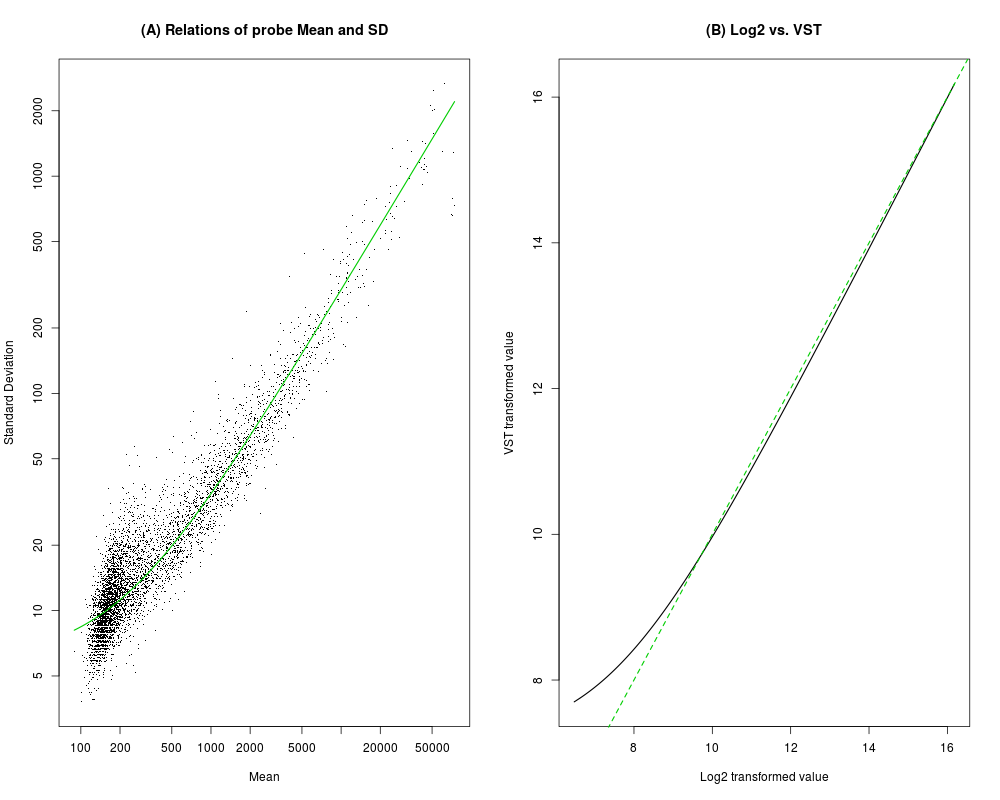
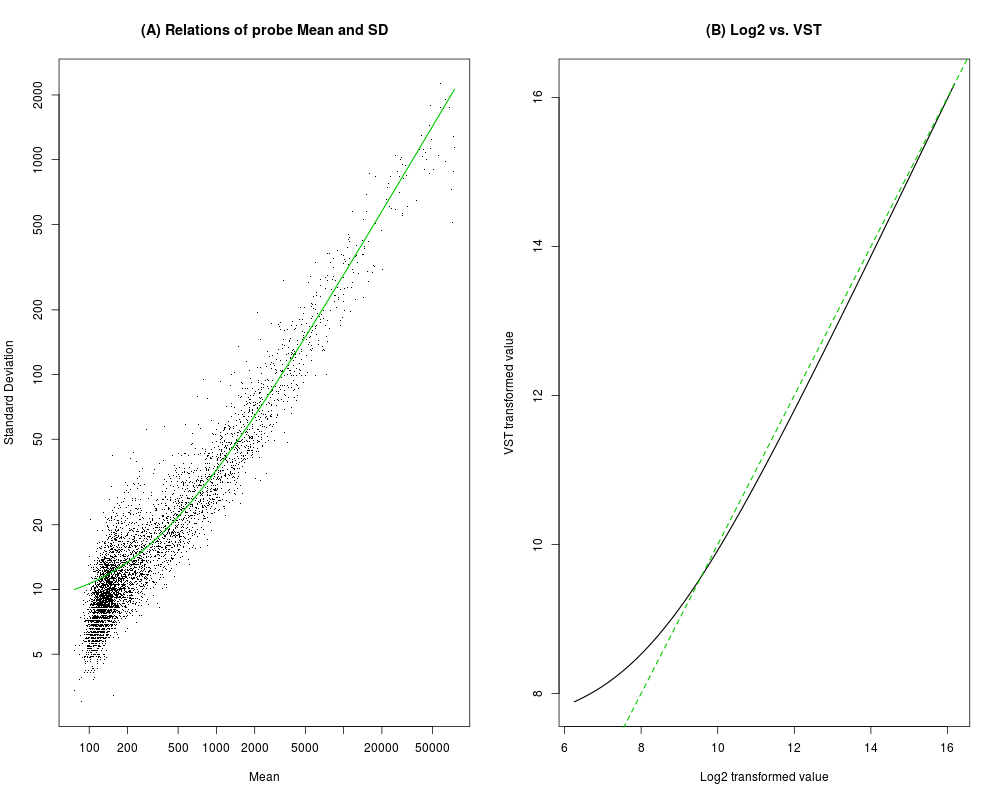
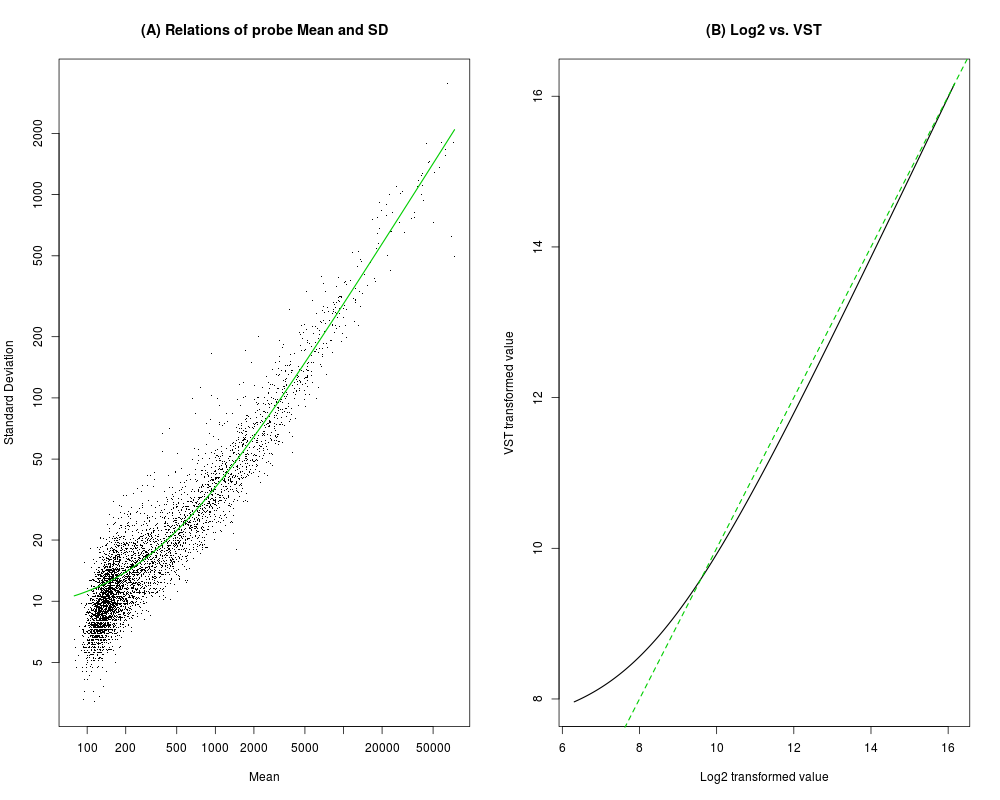
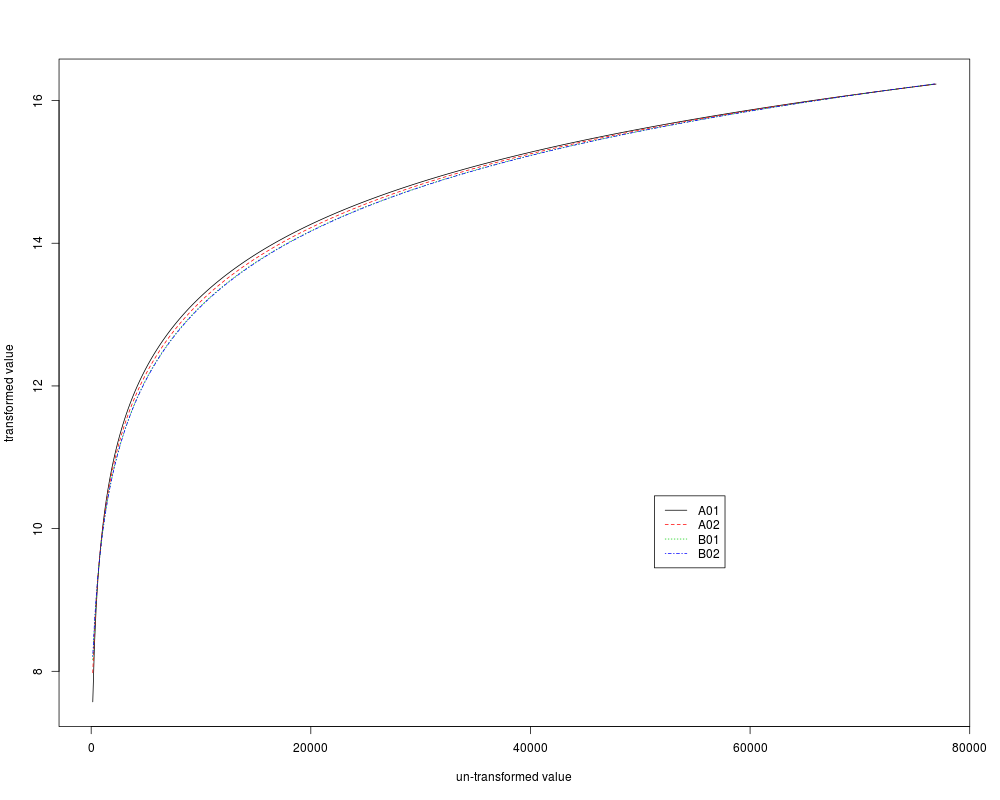
plot the VST (Variance Stabilizing Transform) functionDescriptionplot the VST (Variance Stabilizing Transform) function of VST transformed LumiBatch object or parameters of VST function. UsageplotVST(x, transFun = NULL, plotRange = NULL, addLegend = TRUE, ...) Arguments
Valueinvisibly return the untransformed and transformed values. Author(s)Pan Du See Also
Examples## load example data data(example.lumi) ## Do default VST variance stabilizing transform lumi.T <- lumiT(example.lumi, ifPlot=TRUE) ## plot the transform function plotVST(lumi.T) Results
R version 3.3.1 (2016-06-21) -- "Bug in Your Hair"
Copyright (C) 2016 The R Foundation for Statistical Computing
Platform: x86_64-pc-linux-gnu (64-bit)

R is free software and comes with ABSOLUTELY NO WARRANTY.
You are welcome to redistribute it under certain conditions.
Type 'license()' or 'licence()' for distribution details.

R is a collaborative project with many contributors.
Type 'contributors()' for more information and
'citation()' on how to cite R or R packages in publications.

Type 'demo()' for some demos, 'help()' for on-line help, or
'help.start()' for an HTML browser interface to help.
Type 'q()' to quit R.

> library(lumi)
Loading required package: Biobase
Loading required package: BiocGenerics
Loading required package: parallel

Attaching package: 'BiocGenerics'

The following objects are masked from 'package:parallel':

    clusterApply, clusterApplyLB, clusterCall, clusterEvalQ,
    clusterExport, clusterMap, parApply, parCapply, parLapply,
    parLapplyLB, parRapply, parSapply, parSapplyLB

The following objects are masked from 'package:stats':

    IQR, mad, xtabs

The following objects are masked from 'package:base':

    Filter, Find, Map, Position, Reduce, anyDuplicated, append,
    as.data.frame, cbind, colnames, do.call, duplicated, eval, evalq,
    get, grep, grepl, intersect, is.unsorted, lapply, lengths, mapply,
    match, mget, order, paste, pmax, pmax.int, pmin, pmin.int, rank,
    rbind, rownames, sapply, setdiff, sort, table, tapply, union,
    unique, unsplit

Welcome to Bioconductor

    Vignettes contain introductory material; view with
    'browseVignettes()'. To cite Bioconductor, see
    'citation("Biobase")', and for packages 'citation("pkgname")'.

Setting options('download.file.method.GEOquery'='auto')
Setting options('GEOquery.inmemory.gpl'=FALSE)
> png(filename="/home/ddbj/snapshot/RGM3/R_BC/result/lumi/plotVST.Rd_%03d_medium.png", width=480, height=480)
> ### Name: plotVST
> ### Title: plot the VST (Variance Stabilizing Transform) function
> ### Aliases: plotVST
> ### Keywords: hplot
>
> ### ** Examples
>
>
> ## load example data
> data(example.lumi)
>
> ## Do default VST variance stabilizing transform
> lumi.T <- lumiT(example.lumi, ifPlot=TRUE)
Perform vst transformation ...
2016-07-06 21:32:10 , processing array  1
2016-07-06 21:32:10 , processing array  2
2016-07-06 21:32:10 , processing array  3
2016-07-06 21:32:10 , processing array  4
>
> ## plot the transform function
> plotVST(lumi.T)
>
>
>
>
>
>
> dev.off()
null device
          1
>
|
Created & Maintained by Osamu Ogasawara (osamu.ogasawara@gmail.com) and 