Supported by Dr. Osamu Ogasawara and  . . |
|
Last data update: 2014.03.03 |
Variance Stabilizing TransformationDescriptionStabilizing the expression variance based on the bead level expression variance and mean relations Usage
vst(u, std, nSupport = min(length(u), 500), backgroundStd=NULL, fitMethod = c('linear', 'quadratic'), lowCutoff = 1/3, ifPlot = FALSE)
Arguments
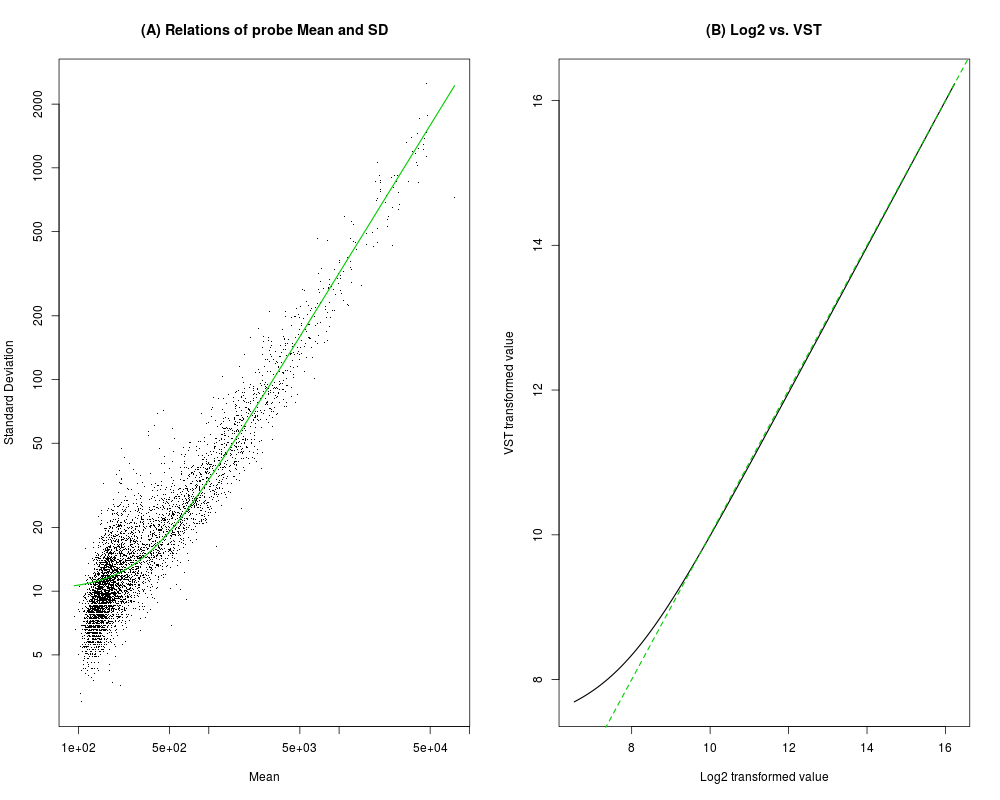
DetailsThe variance-stabilizing transformation (VST) takes the advantage of larger number of technical replicates available on the Illumina microarray. It models the mean-variance relationship of the within-array technical replicates at the bead level of Illumina microarray. An arcsinh transform is then applied to stabilize the variance. See reference for more details. For the methods of fitting the relations between expression variance and mean relations, the 'linear' method is more robust and provides detailed parameters for inverseVST. ValueReturn the transformed (variance stabilized) expression values. Author(s)Pan Du, Simon Lin ReferencesLin, S.M., Du, P., Kibbe, W.A., "Model-based Variance-stabilizing Transformation for Illumina Mi-croarray Data", submitted See Also
Examples## load example data data(example.lumi) ## get the gene expression mean for one chip u <- exprs(example.lumi)[,1] ## get the gene standard deviation for one chip std <- se.exprs(example.lumi)[,1] ## do variance stabilizing transform transformedU <- vst(u, std) ## do variance stabilizing transform with plotting intermediate result transformedU <- vst(u, std, ifPlot=TRUE) Results
R version 3.3.1 (2016-06-21) -- "Bug in Your Hair"
Copyright (C) 2016 The R Foundation for Statistical Computing
Platform: x86_64-pc-linux-gnu (64-bit)

R is free software and comes with ABSOLUTELY NO WARRANTY.
You are welcome to redistribute it under certain conditions.
Type 'license()' or 'licence()' for distribution details.

R is a collaborative project with many contributors.
Type 'contributors()' for more information and
'citation()' on how to cite R or R packages in publications.

Type 'demo()' for some demos, 'help()' for on-line help, or
'help.start()' for an HTML browser interface to help.
Type 'q()' to quit R.

> library(lumi)
Loading required package: Biobase
Loading required package: BiocGenerics
Loading required package: parallel

Attaching package: 'BiocGenerics'

The following objects are masked from 'package:parallel':

    clusterApply, clusterApplyLB, clusterCall, clusterEvalQ,
    clusterExport, clusterMap, parApply, parCapply, parLapply,
    parLapplyLB, parRapply, parSapply, parSapplyLB

The following objects are masked from 'package:stats':

    IQR, mad, xtabs

The following objects are masked from 'package:base':

    Filter, Find, Map, Position, Reduce, anyDuplicated, append,
    as.data.frame, cbind, colnames, do.call, duplicated, eval, evalq,
    get, grep, grepl, intersect, is.unsorted, lapply, lengths, mapply,
    match, mget, order, paste, pmax, pmax.int, pmin, pmin.int, rank,
    rbind, rownames, sapply, setdiff, sort, table, tapply, union,
    unique, unsplit

Welcome to Bioconductor

    Vignettes contain introductory material; view with
    'browseVignettes()'. To cite Bioconductor, see
    'citation("Biobase")', and for packages 'citation("pkgname")'.

Setting options('download.file.method.GEOquery'='auto')
Setting options('GEOquery.inmemory.gpl'=FALSE)
> png(filename="/home/ddbj/snapshot/RGM3/R_BC/result/lumi/vst.Rd_%03d_medium.png", width=480, height=480)
> ### Name: vst
> ### Title: Variance Stabilizing Transformation
> ### Aliases: vst
> ### Keywords: methods
>
> ### ** Examples
>
> ## load example data
> data(example.lumi)
>
> ## get the gene expression mean for one chip
> u <- exprs(example.lumi)[,1]
> ## get the gene standard deviation for one chip
> std <- se.exprs(example.lumi)[,1]
>
> ## do variance stabilizing transform
> transformedU <- vst(u, std)
>
> ## do variance stabilizing transform with plotting intermediate result
> transformedU <- vst(u, std, ifPlot=TRUE)
>
>
>
>
>
>
>
> dev.off()
null device
          1
>
|