Supported by Dr. Osamu Ogasawara and  . . |
|
Last data update: 2014.03.03 |
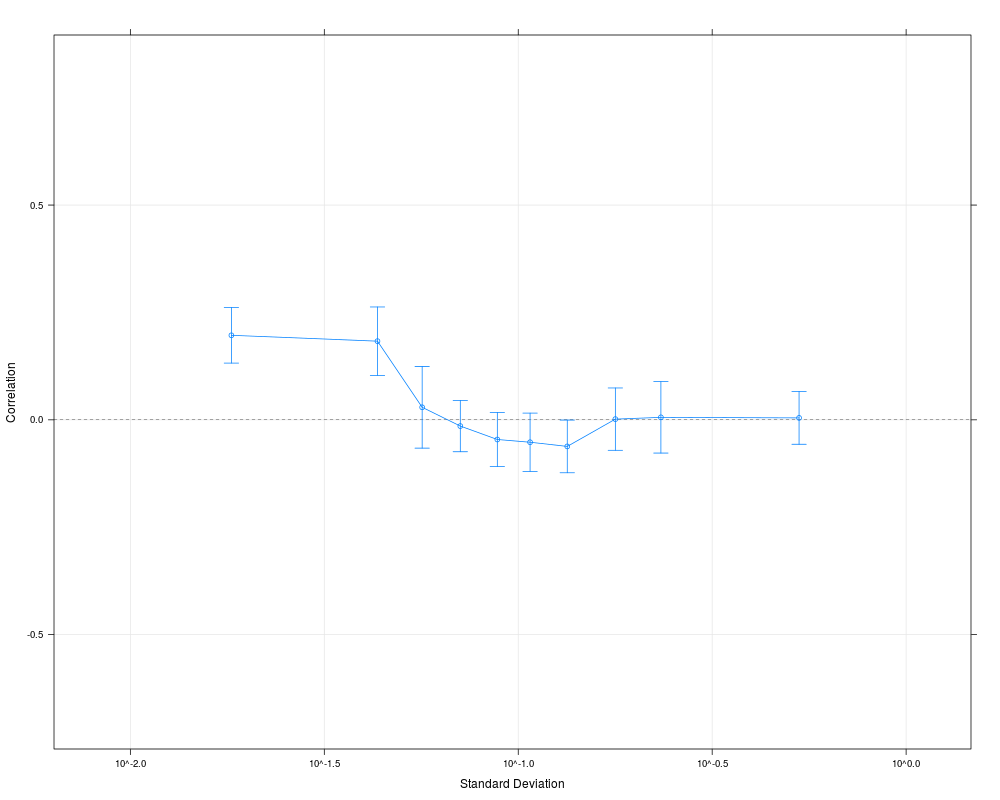
Sample correlations for random pairs of genesDescription
UsageCorrSample(x, np, seed, rp, ndx) RandPairs(probes, number) Arguments
DetailsThe sample of random pairs can be specified in a replicable manner either via ValueAn object of class The data frame has
Author(s)Alexander Ploner Alexander.Ploner@ki.se ReferencesPloner A, Miller LD, Hall P, Bergh J, Pawitan Y. Correlation test to assess low-level processing of high-density oligonucleotide microarray data. BMC Bioinformatics, 2005, 6(1):80 http://www.pubmedcentral.gov/articlerender.fcgi?tool=pubmed&pubmedid=15799785 See Also
Examples# Get small example data data(oligodata) dim(datA.rma) # Compute the correlations for 500 random pairs, # that is ca. 1/1000 of all possible pairs # Larger numbers are reasonable for larger data sets cs1 = CorrSample(datA.rma, 500, seed=210) cs1[1:5,] # Clear correlation for pairs of genes with low average variability plot(cs1) # A different way of specifying the same set.seed(210) rp = RandPairs(rownames(datA.rma), 500) cs2 = CorrSample(datA.rma, rp=rp) cs2[1:5,] plot(cs2) Results
R version 3.3.1 (2016-06-21) -- "Bug in Your Hair"
Copyright (C) 2016 The R Foundation for Statistical Computing
Platform: x86_64-pc-linux-gnu (64-bit)

R is free software and comes with ABSOLUTELY NO WARRANTY.
You are welcome to redistribute it under certain conditions.
Type 'license()' or 'licence()' for distribution details.

R is a collaborative project with many contributors.
Type 'contributors()' for more information and
'citation()' on how to cite R or R packages in publications.

Type 'demo()' for some demos, 'help()' for on-line help, or
'help.start()' for an HTML browser interface to help.
Type 'q()' to quit R.

> library(maCorrPlot)
Loading required package: lattice
> png(filename="/home/ddbj/snapshot/RGM3/R_BC/result/maCorrPlot/CorrSample.Rd_%03d_medium.png", width=480, height=480)
> ### Name: CorrSample
> ### Title: Sample correlations for random pairs of genes
> ### Aliases: CorrSample RandPairs
> ### Keywords: datagen
>
> ### ** Examples
>
> # Get small example data
> data(oligodata)
> dim(datA.rma)
[1] 1000   30
>
> # Compute the correlations for 500 random pairs,
> # that is ca. 1/1000 of all possible pairs
> # Larger numbers are reasonable for larger data sets
> cs1 = CorrSample(datA.rma, 500, seed=210)
> cs1[1:5,]
  Correlation     StdDev     Mean       sd1       sd2        m1        m2 ndx1
1  -0.1558784 0.08655279 7.649430 0.1904952 0.4543569  7.010783  8.288077  513
2  -0.3357701 0.24912586 9.249972 0.5554773 0.4484897  7.424855 11.075090  894
3  -0.1475604 0.07512037 6.364299 0.2128482 0.3529294  5.868567  6.860031  299
4   0.1271111 0.08460454 7.558578 0.2529661 0.3344501  7.490713  7.626443  278
5  -0.2654174 0.05902537 7.821525 0.3925727 0.1503553 10.225949  5.417101  464
  ndx2
1  835
2  446
3   82
4   39
5  201
>
> # Clear correlation for pairs of genes with low average variability
> plot(cs1)
>
> # A different way of specifying the same
> set.seed(210)
> rp = RandPairs(rownames(datA.rma), 500)
> cs2 = CorrSample(datA.rma, rp=rp)
> cs2[1:5,]
  Correlation     StdDev     Mean       sd1       sd2        m1        m2
1  -0.1558784 0.08655279 7.649430 0.1904952 0.4543569  7.010783  8.288077
2  -0.3357701 0.24912586 9.249972 0.5554773 0.4484897  7.424855 11.075090
3  -0.1475604 0.07512037 6.364299 0.2128482 0.3529294  5.868567  6.860031
4   0.1271111 0.08460454 7.558578 0.2529661 0.3344501  7.490713  7.626443
5  -0.2654174 0.05902537 7.821525 0.3925727 0.1503553 10.225949  5.417101
    ndx1   ndx2
1 g11447 g18678
2 g20108  g9801
3  g6570  g1925
4  g5975   g930
5 g10165  g4530
> plot(cs2)
>
>
>
>
>
> dev.off()
null device
          1
>
|