Supported by Dr. Osamu Ogasawara and  . . |
|
Last data update: 2014.03.03 |
Calculate confidence intervals for grouped valuesDescription
UsageCutCI(dat, number = 10, func = mean, alpha=0.95) CIrho(rho, alpha = 0.95) Arguments
DetailsThe quantiles for the confidence interval are taken from the standard normal distribution, so a reasonable number of observations per interval would be good. Value
See Also
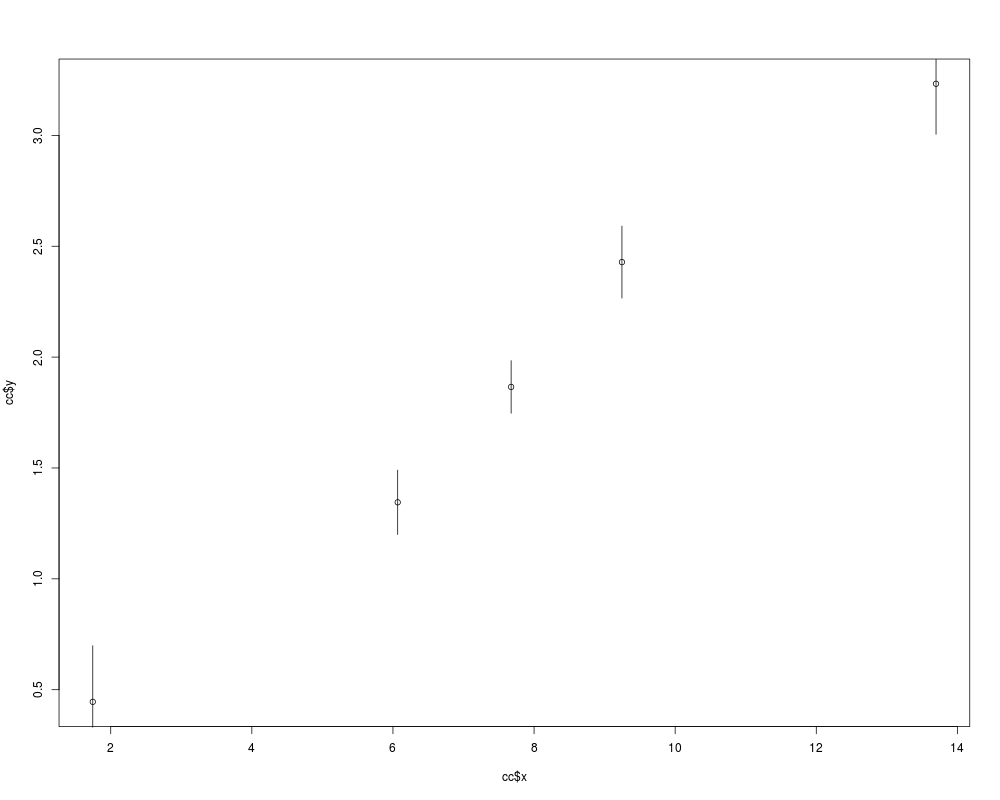
Examplesx = rnorm(100, mean=2) CIrho(x) y = 2 + 3*x + rnorm(100) cc = CutCI(cbind(x,y), number=5) print(cc) # Show it plot(cc$x, cc$y) arrows(cc$x, cc$yci[,1], cc$x, cc$yci[,2], length=0) Results
R version 3.3.1 (2016-06-21) -- "Bug in Your Hair"
Copyright (C) 2016 The R Foundation for Statistical Computing
Platform: x86_64-pc-linux-gnu (64-bit)

R is free software and comes with ABSOLUTELY NO WARRANTY.
You are welcome to redistribute it under certain conditions.
Type 'license()' or 'licence()' for distribution details.

R is a collaborative project with many contributors.
Type 'contributors()' for more information and
'citation()' on how to cite R or R packages in publications.

Type 'demo()' for some demos, 'help()' for on-line help, or
'help.start()' for an HTML browser interface to help.
Type 'q()' to quit R.

> library(maCorrPlot)
Loading required package: lattice
> png(filename="/home/ddbj/snapshot/RGM3/R_BC/result/maCorrPlot/CutCI.Rd_%03d_medium.png", width=480, height=480)
> ### Name: CutCI
> ### Title: Calculate confidence intervals for grouped values
> ### Aliases: CutCI CIrho
> ### Keywords: utilities
>
> ### ** Examples
>
> x = rnorm(100, mean=2)
> CIrho(x)
      CL       CU
1.728857 2.156790
>
> y = 2 + 3*x + rnorm(100)
> cc = CutCI(cbind(x,y), number=5)
> print(cc)
$x
[1]  1.790562  6.288306  7.974450  9.972967 13.653822

$y
(-1.68,5.26]  (5.26,7.05]  (7.05,8.72]  (8.72,11.2]  (11.2,16.1]
   0.3846425    1.3971805    2.0252550    2.5918733    3.3151672

$yci
                    CL        CU
(-1.68,5.26] 0.1209445 0.6483405
(5.26,7.05]  1.2582086 1.5361525
(7.05,8.72]  1.8995578 2.1509521
(8.72,11.2]  2.3834760 2.8002707
(11.2,16.1]  3.1531429 3.4771915

>
> # Show it
> plot(cc$x, cc$y)
> arrows(cc$x, cc$yci[,1], cc$x, cc$yci[,2], length=0)
>
>
>
>
>
> dev.off()
null device
          1
>
|