Supported by Dr. Osamu Ogasawara and  . . |
|
Last data update: 2014.03.03 |
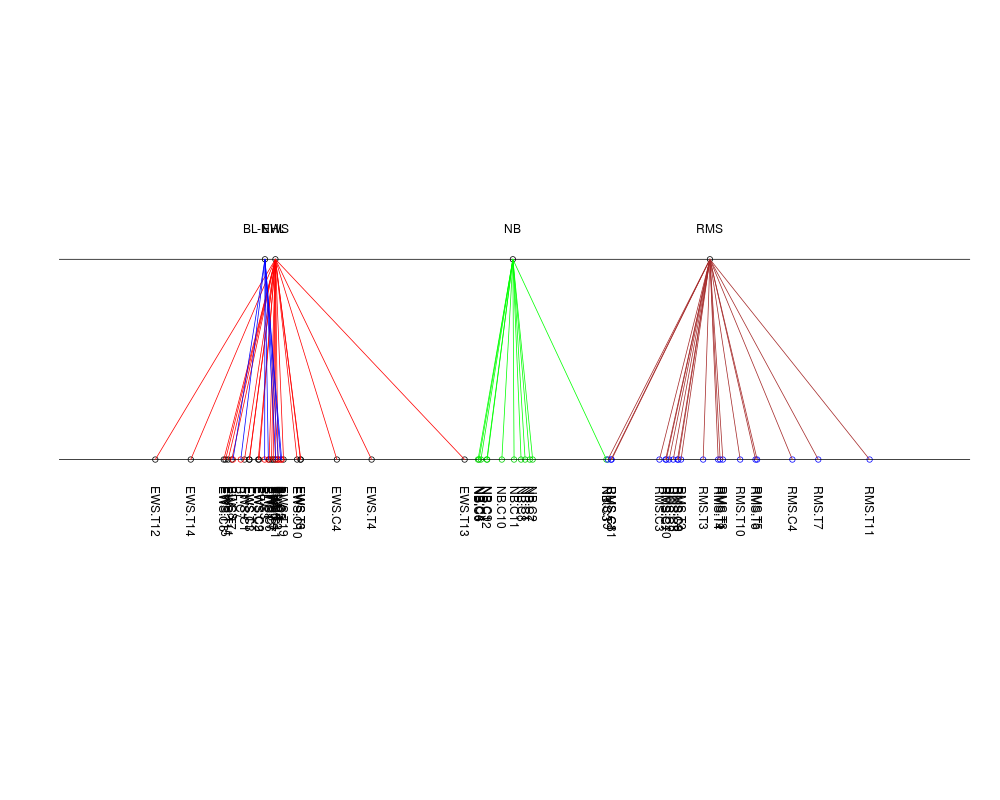
Plot 1D graph of results from between group analysisDescriptionPlots a 1D graph, of results of between group analysis similar to that in Culhane et al., 2002. Usagebetween.graph(x, ax = 1, cols = NULL, hor = TRUE, scaled=TRUE, centnames=NULL, varnames=NULL, ...) Arguments
DetailsThis will produce a figure similar to Figure 1 in the paper by Culhane et al., 2002.
To plot a 1D graph from other multivariate analysis such as PCA ( Author(s)Aedin Culhane ReferencesCulhane AC, et al., 2002 Between-group analysis of microarray data. Bioinformatics. 18(12):1600-8. See Also
Examples
data(khan)
if (require(ade4, quiet = TRUE)) {
khan.bga<-bga(khan$train, khan$train.classes)
}
between.graph(khan.bga)
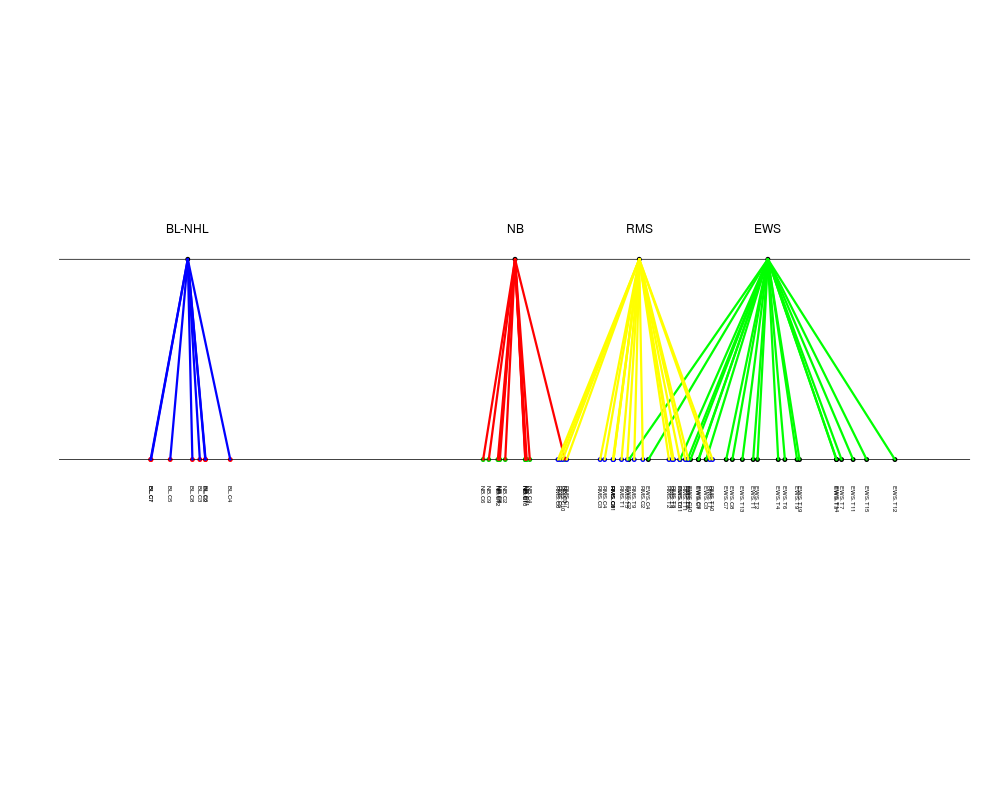
between.graph(khan.bga, ax=2, lwd=3, cex=0.5, col=c("green","blue", "red", "yellow"))
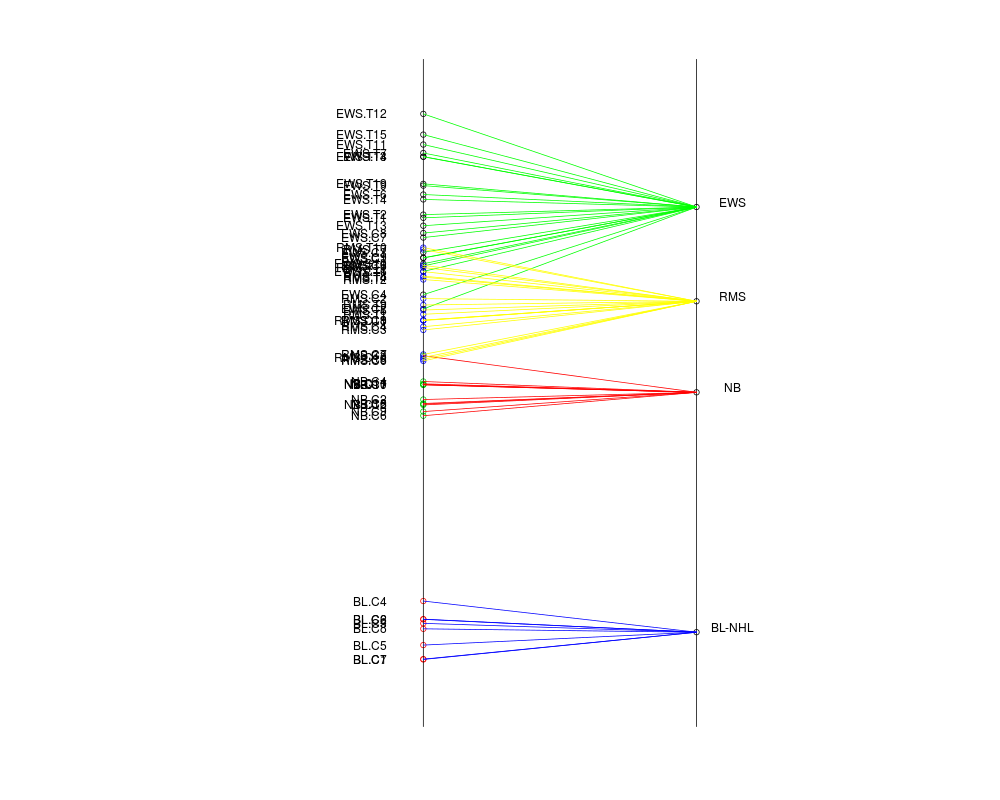
between.graph(khan.bga, ax=2, hor=FALSE, col=c("green","blue", "red", "yellow"))
Results
R version 3.3.1 (2016-06-21) -- "Bug in Your Hair"
Copyright (C) 2016 The R Foundation for Statistical Computing
Platform: x86_64-pc-linux-gnu (64-bit)

R is free software and comes with ABSOLUTELY NO WARRANTY.
You are welcome to redistribute it under certain conditions.
Type 'license()' or 'licence()' for distribution details.

R is a collaborative project with many contributors.
Type 'contributors()' for more information and
'citation()' on how to cite R or R packages in publications.

Type 'demo()' for some demos, 'help()' for on-line help, or
'help.start()' for an HTML browser interface to help.
Type 'q()' to quit R.

> library(made4)
Loading required package: ade4
Loading required package: RColorBrewer
Loading required package: gplots

Attaching package: 'gplots'

The following object is masked from 'package:stats':

    lowess

Loading required package: scatterplot3d
> png(filename="/home/ddbj/snapshot/RGM3/R_BC/result/made4/between.graph.Rd_%03d_medium.png", width=480, height=480)
> ### Name: between.graph
> ### Title: Plot 1D graph of results from between group analysis
> ### Aliases: between.graph
> ### Keywords: multivariate hplot
>
> ### ** Examples
>
> data(khan)
> if (require(ade4, quiet = TRUE)) {
+ khan.bga<-bga(khan$train, khan$train.classes)
+ }
>
> between.graph(khan.bga)
> between.graph(khan.bga, ax=2, lwd=3, cex=0.5, col=c("green","blue", "red", "yellow"))
> between.graph(khan.bga, ax=2,  hor=FALSE, col=c("green","blue", "red", "yellow"))
>
>
>
>
>
> dev.off()
null device
          1
>
|