Supported by Dr. Osamu Ogasawara and  . . |
|
Last data update: 2014.03.03 |
Generate 3D graph(s) using scatterplot3dDescription
Usagedo3d(dataset, x = 1, y = 2, z = 3, angle = 40, classvec = NULL, classcol = NULL, col = NULL, cex.lab=0.3, pch=19, cex.symbols=1, ...) rotate3d(dataset, x = 1, y = 2, z = 3, beg = 180, end = 360, step = 12, savefiles = FALSE, classvec = NULL, classcol = NULL, col = NULL, ...) Arguments
DetailsThis calls scatterplot3d to plot a 3d representation of results. It is also worth exploring the package library(rgl) plot3d(khan.coa$co[,1], khan.coa$co[,2],khan.coa$co[,3], size=4, col=khan$train.classes) rgl.snapshot(file="test.png", top=TRUE) rgl.close() ValueProduces plots of the xyz coordinates. Author(s)Aedin Culhane See AlsoSee Also Examples
data(khan)
if (require(ade4, quiet = TRUE)) {
khan.coa<-dudi.coa(khan$train, scannf=FALSE, nf=5)
}
par(mfrow=c(2,1))
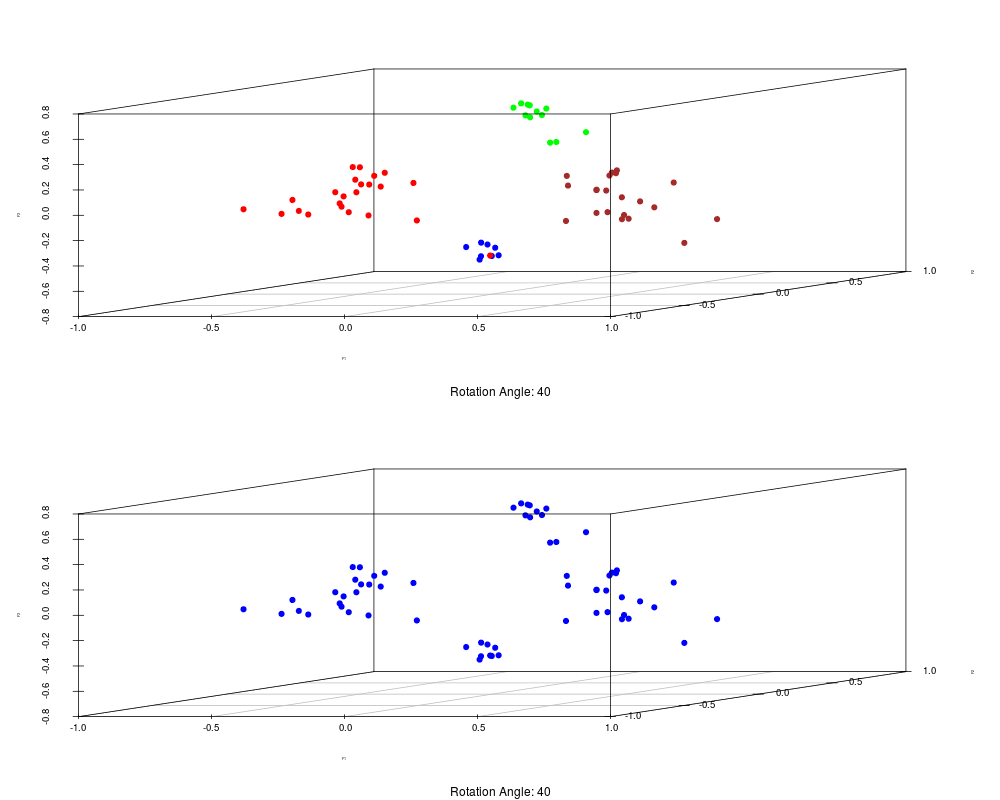
do3d(khan.coa$co, classvec=khan$train.classes)
do3d(khan.coa$co, col="blue")
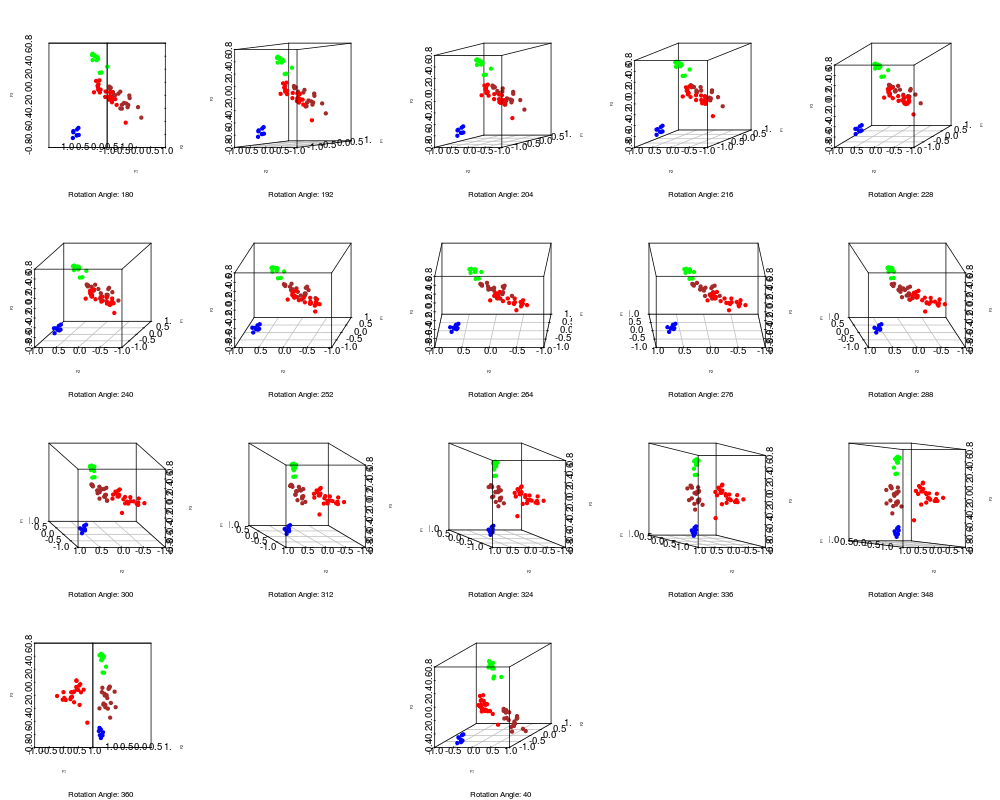
rotate3d(khan.coa$co,classvec=khan$train.classes)
khan.bga<-bga(khan$train, khan$train.classes)
plot.new()
par(bg="black")
do3d(khan.bga$bet$ls, classvec=khan$train.classes)
Results
R version 3.3.1 (2016-06-21) -- "Bug in Your Hair"
Copyright (C) 2016 The R Foundation for Statistical Computing
Platform: x86_64-pc-linux-gnu (64-bit)

R is free software and comes with ABSOLUTELY NO WARRANTY.
You are welcome to redistribute it under certain conditions.
Type 'license()' or 'licence()' for distribution details.

R is a collaborative project with many contributors.
Type 'contributors()' for more information and
'citation()' on how to cite R or R packages in publications.

Type 'demo()' for some demos, 'help()' for on-line help, or
'help.start()' for an HTML browser interface to help.
Type 'q()' to quit R.

> library(made4)
Loading required package: ade4
Loading required package: RColorBrewer
Loading required package: gplots

Attaching package: 'gplots'

The following object is masked from 'package:stats':

    lowess

Loading required package: scatterplot3d
> png(filename="/home/ddbj/snapshot/RGM3/R_BC/result/made4/do3d.Rd_%03d_medium.png", width=480, height=480)
> ### Name: do3d
> ### Title: Generate 3D graph(s) using scatterplot3d
> ### Aliases: do3d rotate3d
> ### Keywords: hplot
>
> ### ** Examples
>
> data(khan)
> if (require(ade4, quiet = TRUE)) {
+ khan.coa<-dudi.coa(khan$train, scannf=FALSE, nf=5)
+ }
> par(mfrow=c(2,1))
> do3d(khan.coa$co, classvec=khan$train.classes)
> do3d(khan.coa$co, col="blue")
> rotate3d(khan.coa$co,classvec=khan$train.classes)
> khan.bga<-bga(khan$train, khan$train.classes)
> plot.new()
> par(bg="black")
> do3d(khan.bga$bet$ls, classvec=khan$train.classes)
>
>
>
>
>
> dev.off()
null device
          1
>
|