R: Plot 1D graph of axis from multivariate analysis
graph1D
R Documentation
Plot 1D graph of axis from multivariate analysis
Description
Draw 1D plot of an axis from multivariate analysis. Useful for visualising an individual axis from
analyses such as PCA dudi.pca or COA dudi.coa.
It accepts a factor so that groups of points can be coloured.
It can also be used for graphing genes, and will only label n genes at the ends of the axis.
vector, matrix, or data.frame, which contains a column
with axis coordinates
ax
Numeric, indicating column of matrix, or data.frame to be plotted.
The default is 1.
classvec
Factor, indicating sub-groupings or classes in dfx or dfx[,ax]
hor
Logical, indicating whether the graph should be drawn horizontal or vertically.
The default is vertically.
s.nam
Vector. labels of dfx, The default is row.names(dfx)
n
Numeric. Whether all rows should be plotted, n=10 would label only the 10 variables at the
end of the axis. By default all variables (row of dfx) are labelled
scaled
A logical indicating whether the plot should be scaled to fit. The default is TRUE
col
A character or vector indicating the colour(s) for points or groups of points. If points
are to be coloured according to a factor, length(col) should equal length(levels(classvec))
width
A vector of length 2, which is the width (of a vertical plot) or height (of a
horizontal plot). This can be increased if variable labels are unreadable. The default is
c(-2,1)
R version 3.3.1 (2016-06-21) -- "Bug in Your Hair"
Copyright (C) 2016 The R Foundation for Statistical Computing
Platform: x86_64-pc-linux-gnu (64-bit)
R is free software and comes with ABSOLUTELY NO WARRANTY.
You are welcome to redistribute it under certain conditions.
Type 'license()' or 'licence()' for distribution details.
R is a collaborative project with many contributors.
Type 'contributors()' for more information and
'citation()' on how to cite R or R packages in publications.
Type 'demo()' for some demos, 'help()' for on-line help, or
'help.start()' for an HTML browser interface to help.
Type 'q()' to quit R.
> library(made4)
Loading required package: ade4
Loading required package: RColorBrewer
Loading required package: gplots
Attaching package: 'gplots'
The following object is masked from 'package:stats':
lowess
Loading required package: scatterplot3d
> png(filename="/home/ddbj/snapshot/RGM3/R_BC/result/made4/graph1D.Rd_%03d_medium.png", width=480, height=480)
> ### Name: graph1D
> ### Title: Plot 1D graph of axis from multivariate analysis
> ### Aliases: graph1D
> ### Keywords: hplot manip
>
> ### ** Examples
>
> a<-rnorm(25)
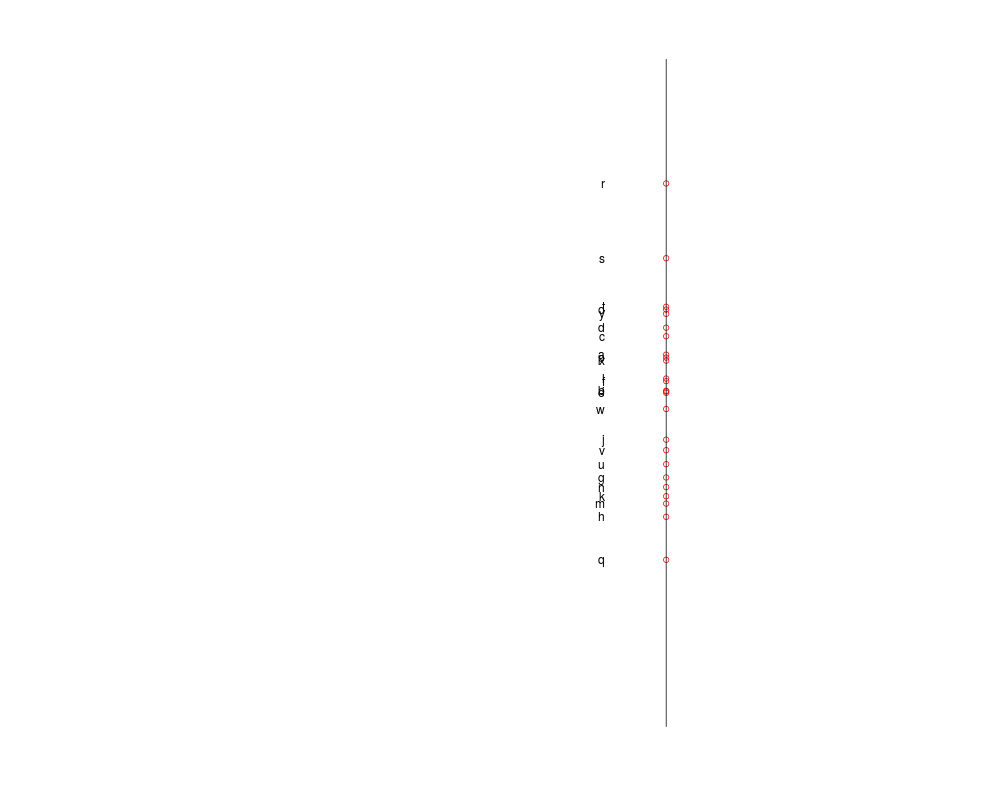
> graph1D(a, s.nam=letters[1:25])
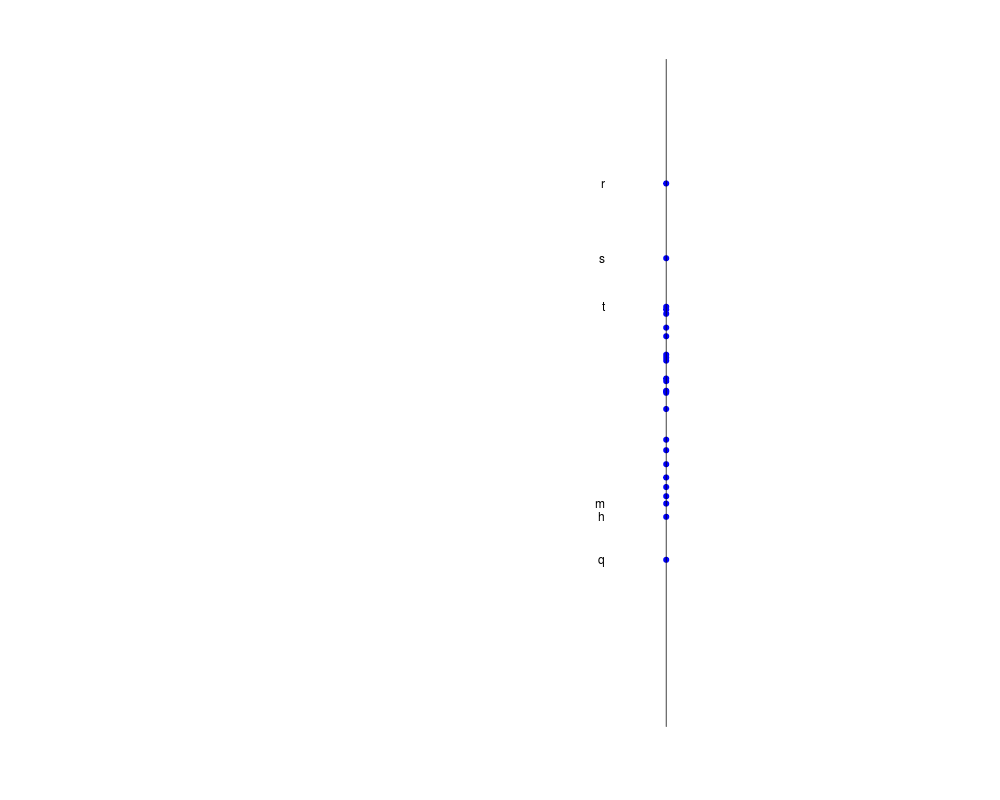
> graph1D(a, s.nam=letters[1:25], col="blue", pch=19, n=3)
[1] 2 7 8 13 17 22
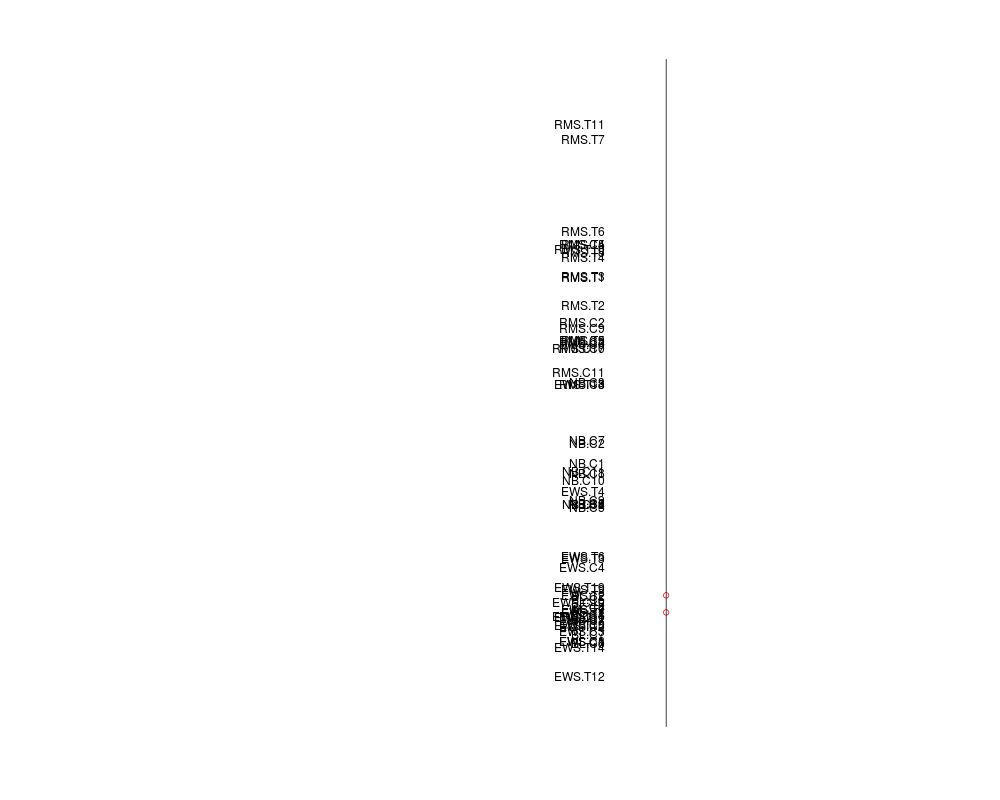
> data(khan)
> if (require(ade4, quiet = TRUE)) {
+ khan.coa<-dudi.coa(khan$train, scan=FALSE, nf=2)
+ }
> graph1D(khan.coa$co, ax=1)
>
>
>
>
>
> dev.off()
null device
1
>
 .
.