Supported by Dr. Osamu Ogasawara and  . . |
|
Last data update: 2014.03.03 |
Draw boxplot, histogram and hierarchical tree of gene expression dataDescriptionVery simple wrapper function that draws a boxplot, histogram and hierarchical tree of expression data Usageoverview(dataset, labels = NULL, title = "", classvec = NULL, hc = TRUE, boxplot = TRUE, hist = TRUE, returnTree=FALSE) Arguments
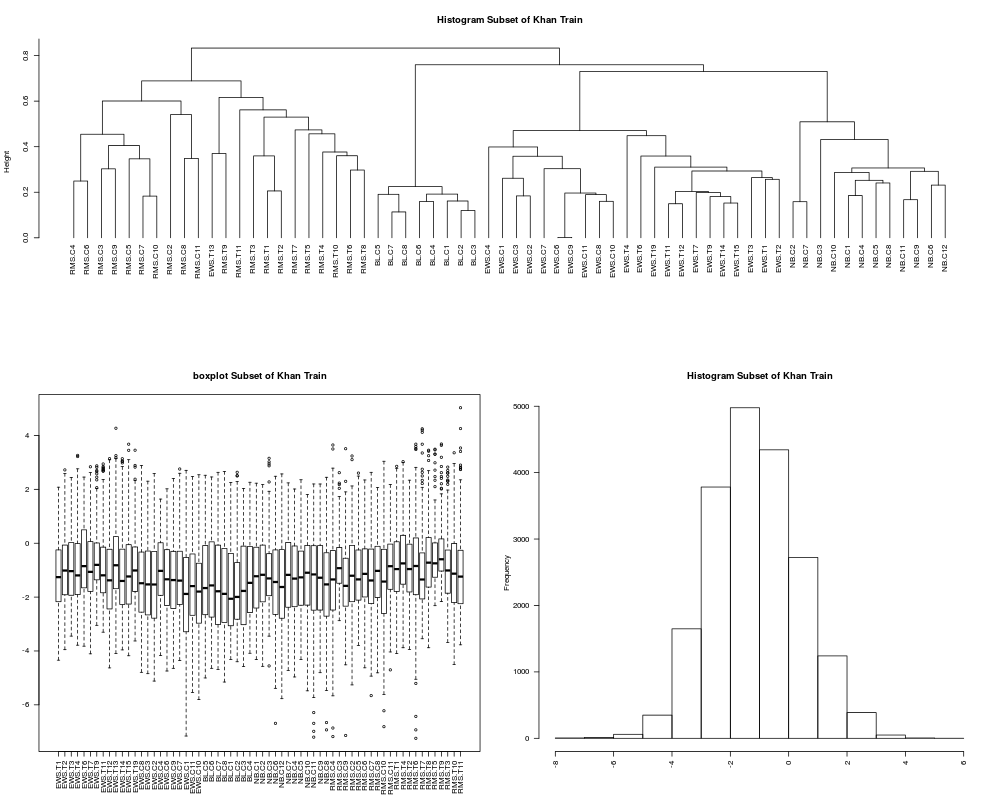
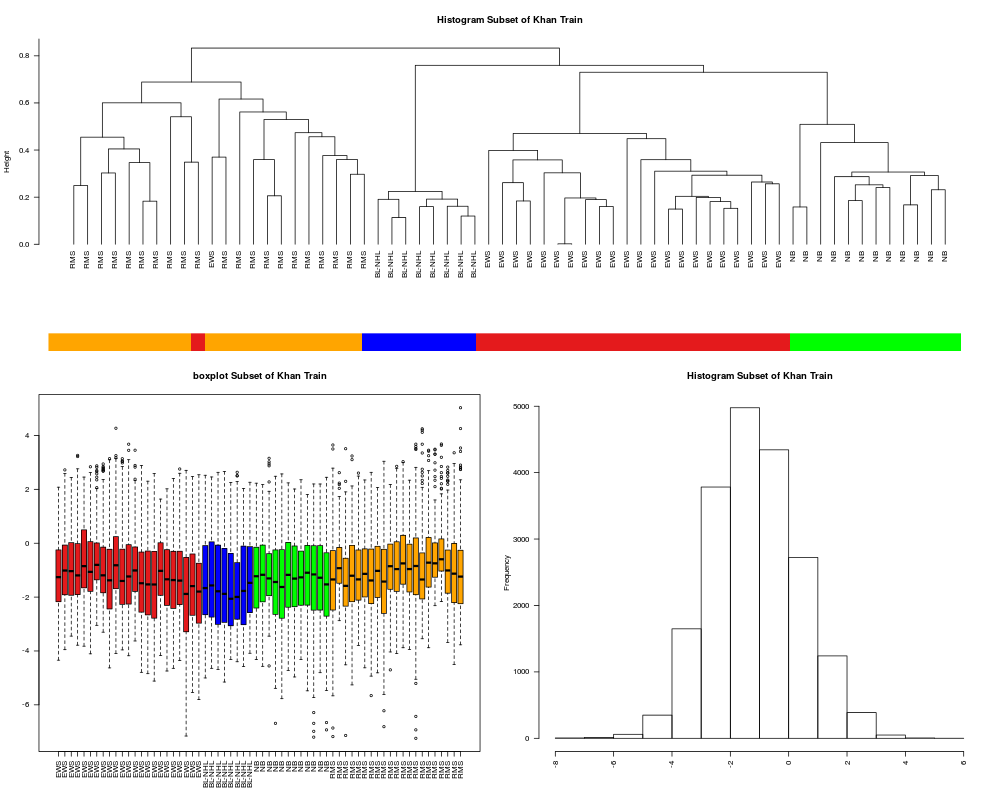
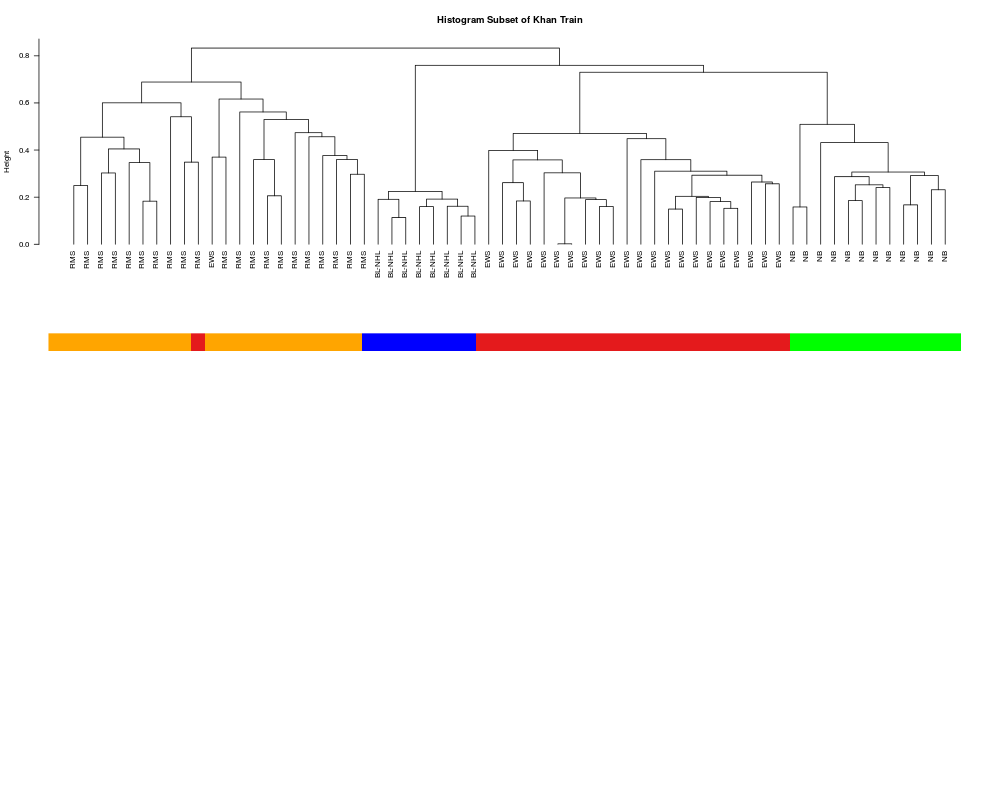
DetailsThe hierarchical plot is produced using average linkage cluster analysis with Pearson's correlation metric as described by Eisen et al.,1999. Author(s)Aedin Culhane See AlsoSee also as Examplesdata(khan) logkhan<-log2(khan$train) print(class(logkhan)) overview(logkhan, title="Subset of Khan Train") overview(logkhan, classvec=khan$train.classes, labels=khan$train.classes,title="Subset of Khan Train") overview(logkhan, classvec=khan$train.classes, labels=khan$train.classes,title="Subset of Khan Train", boxplot=FALSE, his=FALSE) Results
R version 3.3.1 (2016-06-21) -- "Bug in Your Hair"
Copyright (C) 2016 The R Foundation for Statistical Computing
Platform: x86_64-pc-linux-gnu (64-bit)

R is free software and comes with ABSOLUTELY NO WARRANTY.
You are welcome to redistribute it under certain conditions.
Type 'license()' or 'licence()' for distribution details.

R is a collaborative project with many contributors.
Type 'contributors()' for more information and
'citation()' on how to cite R or R packages in publications.

Type 'demo()' for some demos, 'help()' for on-line help, or
'help.start()' for an HTML browser interface to help.
Type 'q()' to quit R.

> library(made4)
Loading required package: ade4
Loading required package: RColorBrewer
Loading required package: gplots

Attaching package: 'gplots'

The following object is masked from 'package:stats':

    lowess

Loading required package: scatterplot3d
> png(filename="/home/ddbj/snapshot/RGM3/R_BC/result/made4/overview.Rd_%03d_medium.png", width=480, height=480)
> ### Name: overview
> ### Title: Draw boxplot, histogram and hierarchical tree of gene expression
> ###   data
> ### Aliases: overview
> ### Keywords: hplot manip
>
> ### ** Examples
>
>   data(khan)
>
>   logkhan<-log2(khan$train)
>   print(class(logkhan))
[1] "data.frame"
>   overview(logkhan, title="Subset of Khan Train")
>   overview(logkhan, classvec=khan$train.classes, labels=khan$train.classes,title="Subset of Khan Train")
>   overview(logkhan, classvec=khan$train.classes, labels=khan$train.classes,title="Subset of Khan Train", boxplot=FALSE, his=FALSE)
>
>
>
>
>
> dev.off()
null device
          1
>
|