Supported by Dr. Osamu Ogasawara and  . . |
|
Last data update: 2014.03.03 |
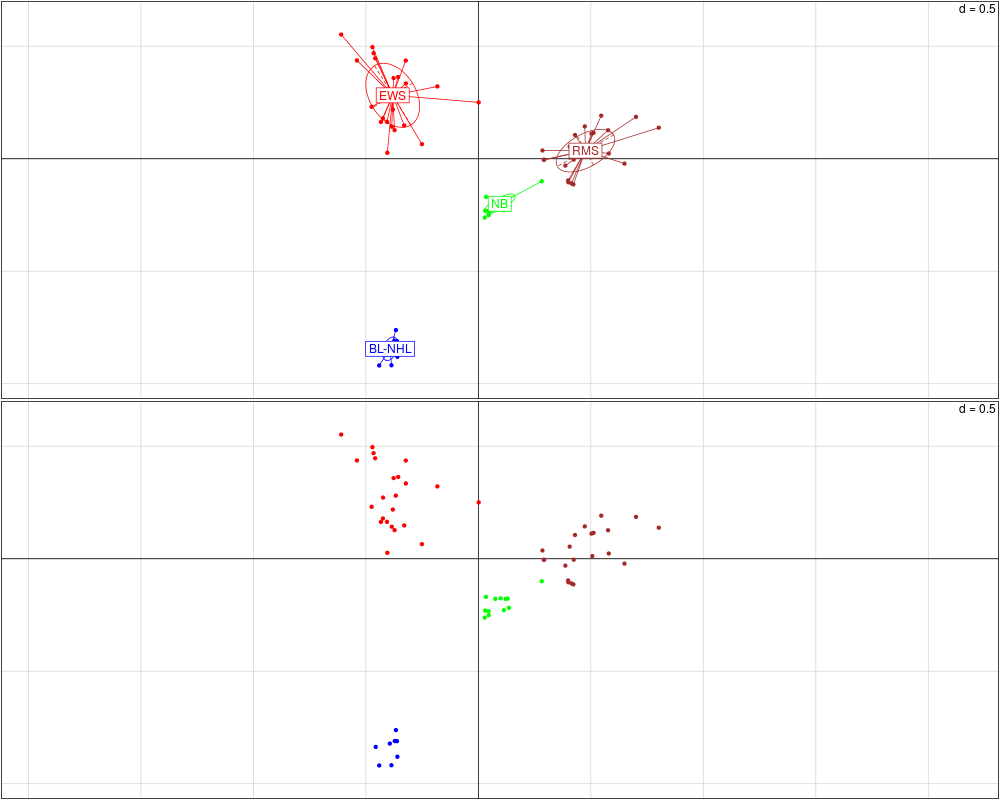
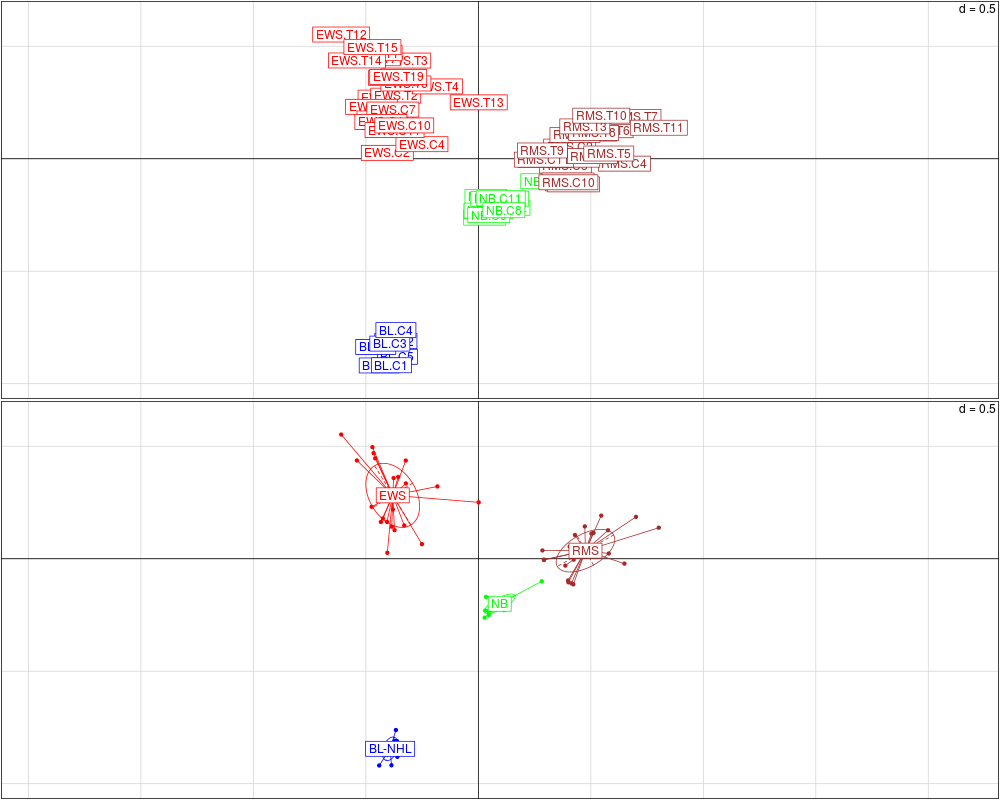
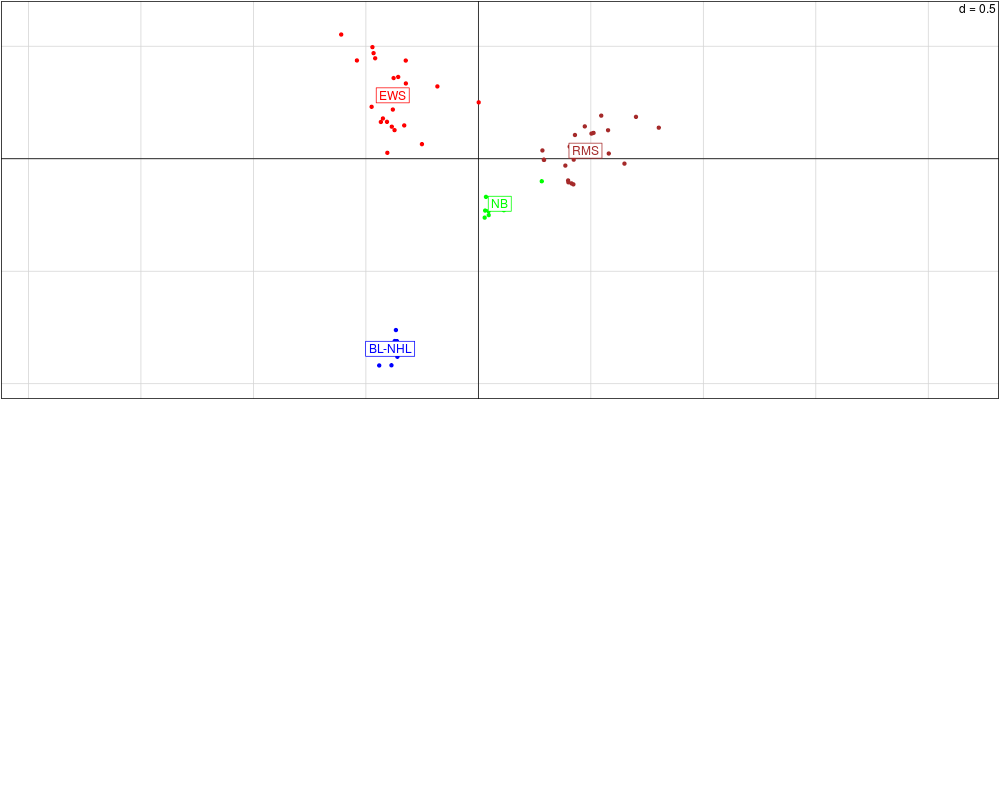
Graph xy plot of variable (array) projections from ordination, between group analysis or coinertia analysis.DescriptionGraph xy plot of variables using s.var, s.groups or s.match.col. Useful for visualising array coordinates ($li) resulting from ord, bga or cia of microarray data. Usage
plotarrays(coord, axis1 = 1, axis2 = 2, arraylabels = NULL, classvec=NULL, graph = c("groups", "simple", "labels", "groups2", "coinertia","coinertia2"), labelsize=1, star=1, ellipse=1, arraycol=NULL, ...)
Arguments
Details
If you wish to return a table or list of the top array at
the end of an axis, use the function ValueAn xy plot Note
Author(s)Aedin Culhane See AlsoSee Also as Examples
data(khan)
if (require(ade4, quiet = TRUE)) {
khan.bga<-bga(khan$train, khan$train.classes)
}
attach(khan.bga)
par(mfrow=c(2,1))
plotarrays(khan.bga)
plotarrays(khan.bga, graph="simple")
plotarrays(khan.bga, graph="labels")
plotarrays(khan.bga, graph="groups")
plotarrays(khan.bga, graph="groups2")
Results
R version 3.3.1 (2016-06-21) -- "Bug in Your Hair"
Copyright (C) 2016 The R Foundation for Statistical Computing
Platform: x86_64-pc-linux-gnu (64-bit)

R is free software and comes with ABSOLUTELY NO WARRANTY.
You are welcome to redistribute it under certain conditions.
Type 'license()' or 'licence()' for distribution details.

R is a collaborative project with many contributors.
Type 'contributors()' for more information and
'citation()' on how to cite R or R packages in publications.

Type 'demo()' for some demos, 'help()' for on-line help, or
'help.start()' for an HTML browser interface to help.
Type 'q()' to quit R.

> library(made4)
Loading required package: ade4
Loading required package: RColorBrewer
Loading required package: gplots

Attaching package: 'gplots'

The following object is masked from 'package:stats':

    lowess

Loading required package: scatterplot3d
> png(filename="/home/ddbj/snapshot/RGM3/R_BC/result/made4/plotarrays.Rd_%03d_medium.png", width=480, height=480)
> ### Name: plotarrays
> ### Title: Graph xy plot of variable (array) projections from ordination,
> ###   between group analysis or coinertia analysis.
> ### Aliases: plotarrays
> ### Keywords: multivariate hplot
>
> ### ** Examples
>
> data(khan)
> if (require(ade4, quiet = TRUE)) {
+ khan.bga<-bga(khan$train, khan$train.classes)
+ }
> attach(khan.bga)
> par(mfrow=c(2,1))
> plotarrays(khan.bga)
> plotarrays(khan.bga, graph="simple")
> plotarrays(khan.bga, graph="labels")
> plotarrays(khan.bga, graph="groups")
> plotarrays(khan.bga, graph="groups2")
>
>
>
>
>
> dev.off()
null device
          1
>
|