Supported by Dr. Osamu Ogasawara and  . . |
|
Last data update: 2014.03.03 |
Draw hierarchical tree of gene expression data with a colorbar for numerous class vectorsDescriptionFunction which performs a hierarchical cluster analysis of data, drawing a dendrogram, with colorbars for different sample covariate beneath the dendrogram UsageprettyDend(dataset, labels = NULL, title = "", classvec = NULL,covars=1,returnTree=FALSE, getPalette=getcol,...) Arguments
DetailsThe hierarchical plot is produced using average linkage cluster analysis with 1- Pearson's correlation metric. The default set of colors used to generate the color bars of the plots can be changed (see example below). By default, if there is only two levels in the factor, the colors will be black and grey. Author(s)Aedin Culhane See Also See also as Examplesdata(khan) logkhan<-log2(khan$train) # Get a character vector which defines which khan samples are cell lines or tissue sample khanAnnot= cbind(as.character(khan$train.classes),khan$cellType) print(khanAnnot[1:3,]) # Add 2 color bar, one for cancer subtype, another for cell type under dendrogram prettyDend(logkhan, classvec=khanAnnot, covars = c(1,2), labels=khan$train.classes) # To change the palette of colors # Use topo.colors(), see colors() for more help on inbuilt palettes prettyDend(logkhan, classvec=khanAnnot, covars = c(1,2), labels=khan$train.classes, getPalette=topo.colors) # To use RColorBrewer Palettes library(RColorBrewer) # Use RColorBrewer Dark2 which contains 8 colors prettyDend(logkhan, classvec=khanAnnot, covars = c(1,2), labels=khan$train.classes, getPalette=function(x) brewer.pal(8,"Dark2")[1:x]) # Use RColorBrewer Set1 which contains 9 colors prettyDend(logkhan, classvec=khanAnnot, covars = c(1,2), labels=khan$train.classes, getPalette=function(x) brewer.pal(9,"Set1")[1:x]) Results
R version 3.3.1 (2016-06-21) -- "Bug in Your Hair"
Copyright (C) 2016 The R Foundation for Statistical Computing
Platform: x86_64-pc-linux-gnu (64-bit)
R is free software and comes with ABSOLUTELY NO WARRANTY.
You are welcome to redistribute it under certain conditions.
Type 'license()' or 'licence()' for distribution details.
R is a collaborative project with many contributors.
Type 'contributors()' for more information and
'citation()' on how to cite R or R packages in publications.
Type 'demo()' for some demos, 'help()' for on-line help, or
'help.start()' for an HTML browser interface to help.
Type 'q()' to quit R.
> library(made4)
Loading required package: ade4
Loading required package: RColorBrewer
Loading required package: gplots
Attaching package: 'gplots'
The following object is masked from 'package:stats':
lowess
Loading required package: scatterplot3d
> png(filename="/home/ddbj/snapshot/RGM3/R_BC/result/made4/prettyDend.Rd_%03d_medium.png", width=480, height=480)
> ### Name: prettyDend
> ### Title: Draw hierarchical tree of gene expression data with a colorbar
> ### for numerous class vectors
> ### Aliases: prettyDend
> ### Keywords: hplot manip
>
> ### ** Examples
>
> data(khan)
> logkhan<-log2(khan$train)
>
>
> # Get a character vector which defines which khan samples are cell lines or tissue sample
> khanAnnot= cbind(as.character(khan$train.classes),khan$cellType)
> print(khanAnnot[1:3,])
[,1] [,2]
[1,] "EWS" "T"
[2,] "EWS" "T"
[3,] "EWS" "T"
>
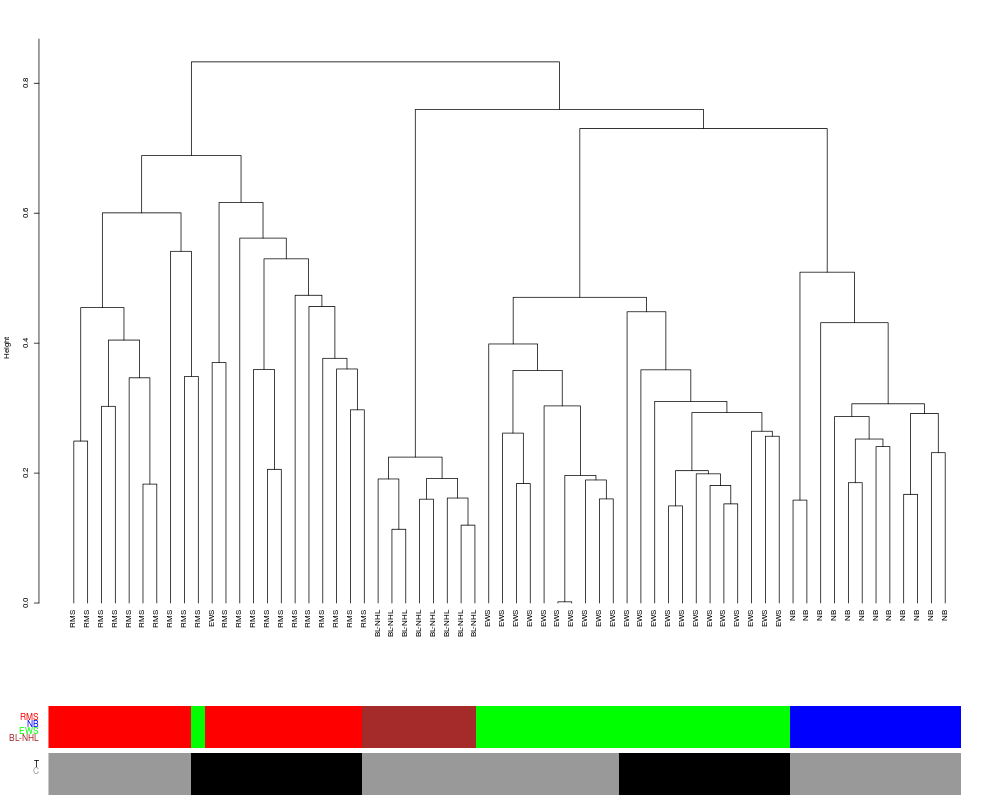
> # Add 2 color bar, one for cancer subtype, another for cell type under dendrogram
> prettyDend(logkhan, classvec=khanAnnot, covars = c(1,2), labels=khan$train.classes)
groups cols
[1,] "RMS" "red"
[2,] "NB" "blue"
[3,] "EWS" "green"
[4,] "BL-NHL" "brown"
groups cols
[1,] "T" "black"
[2,] "C" "grey60"
>
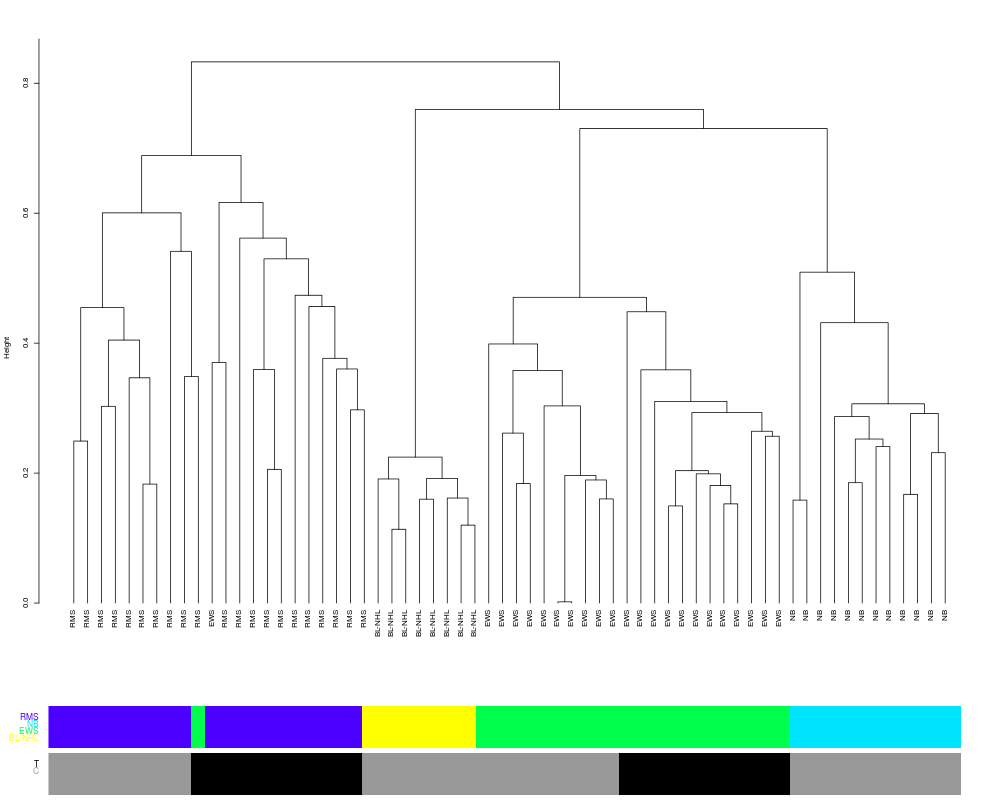
> # To change the palette of colors
> # Use topo.colors(), see colors() for more help on inbuilt palettes
>
> prettyDend(logkhan, classvec=khanAnnot, covars = c(1,2), labels=khan$train.classes, getPalette=topo.colors)
groups cols
[1,] "RMS" "#4C00FFFF"
[2,] "NB" "#00E5FFFF"
[3,] "EWS" "#00FF4DFF"
[4,] "BL-NHL" "#FFFF00FF"
groups cols
[1,] "T" "black"
[2,] "C" "grey60"
>
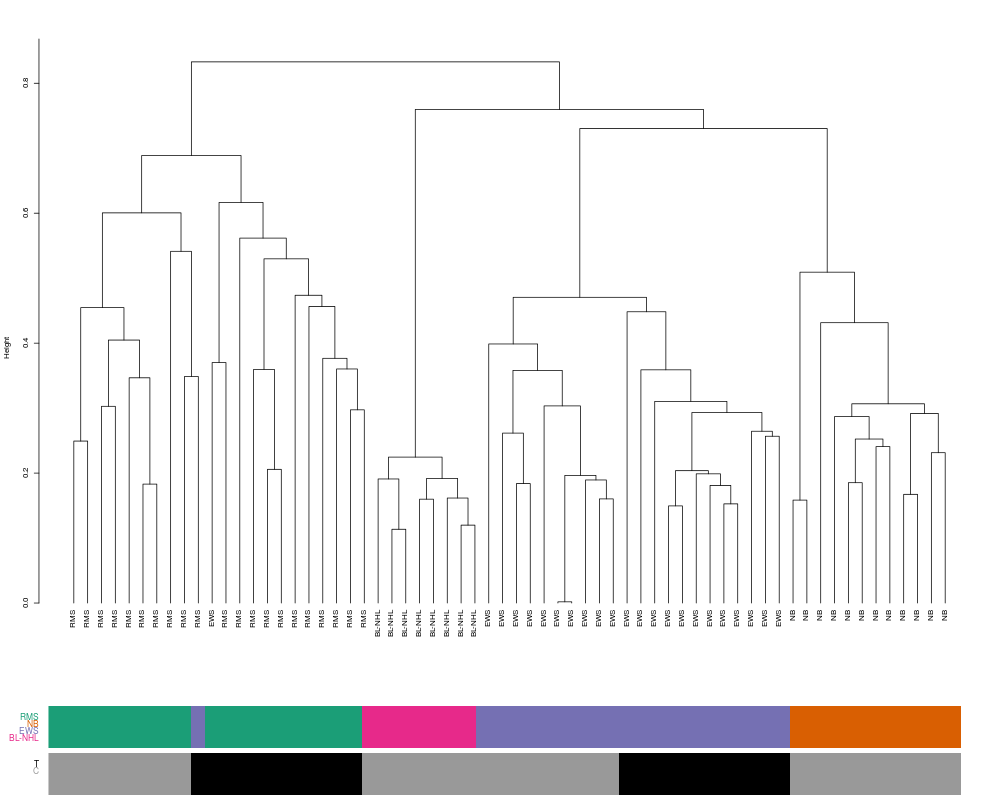
> # To use RColorBrewer Palettes
> library(RColorBrewer)
>
> # Use RColorBrewer Dark2 which contains 8 colors
> prettyDend(logkhan, classvec=khanAnnot, covars = c(1,2), labels=khan$train.classes, getPalette=function(x) brewer.pal(8,"Dark2")[1:x])
groups cols
[1,] "RMS" "#1B9E77"
[2,] "NB" "#D95F02"
[3,] "EWS" "#7570B3"
[4,] "BL-NHL" "#E7298A"
groups cols
[1,] "T" "black"
[2,] "C" "grey60"
>
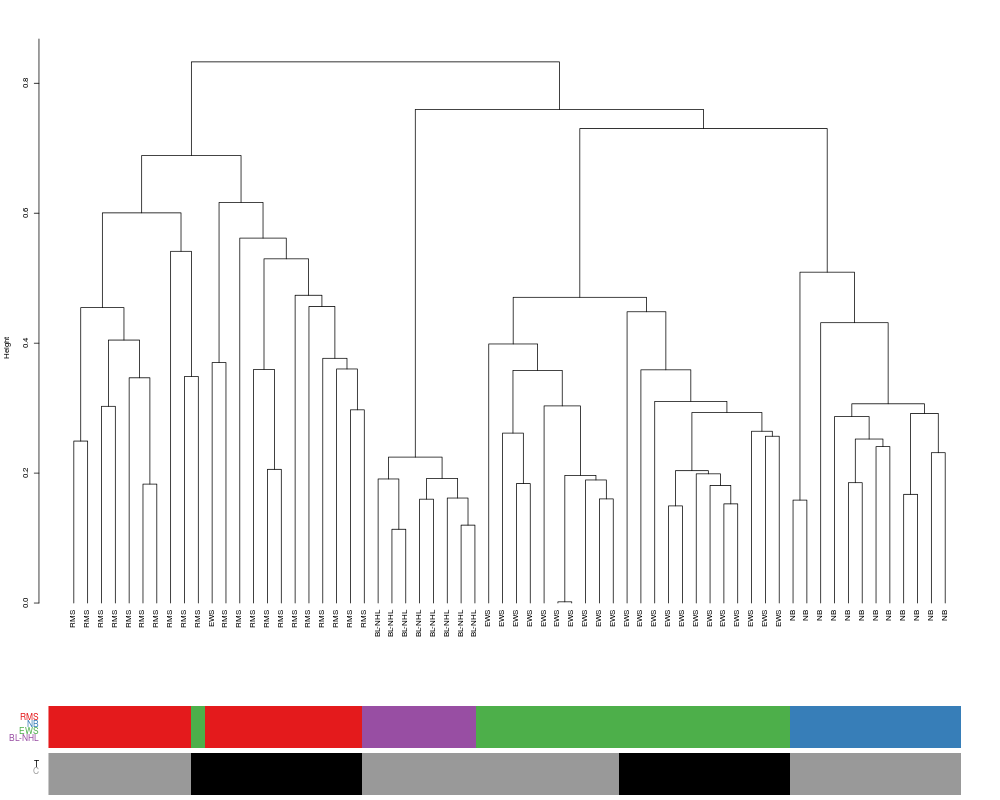
> # Use RColorBrewer Set1 which contains 9 colors
> prettyDend(logkhan, classvec=khanAnnot, covars = c(1,2), labels=khan$train.classes, getPalette=function(x) brewer.pal(9,"Set1")[1:x])
groups cols
[1,] "RMS" "#E41A1C"
[2,] "NB" "#377EB8"
[3,] "EWS" "#4DAF4A"
[4,] "BL-NHL" "#984EA3"
groups cols
[1,] "T" "black"
[2,] "C" "grey60"
>
>
>
>
>
>
> dev.off()
null device
1
>
|