Supported by Dr. Osamu Ogasawara and  . . |
|
Last data update: 2014.03.03 |
Projection of supplementary data onto axes from a between group analysisDescriptionProjection and class prediction of supplementary points onto
axes from a between group analysis, Usagesuppl(dudi.bga, supdata, supvec = NULL, assign=TRUE, ...) ## S3 method for class 'suppl' plot(x, dudi.bga, axis1=1, axis2=2, supvec=sup$true.class, supvec.pred= sup$predicted, ...) Arguments
DetailsAfter performing a between group analysis on a training dataset using
The test dataset must contain the same number of variables (genes) as the training dataset.
The input format of both the training dataset and test dataset are verified using
ValueA list containing:
Author(s)Aedin Culhane ReferencesCulhane AC, et al., 2002 Between-group analysis of microarray data. Bioinformatics. 18(12):1600-8. See AlsoSee Also Examples
data(khan)
#khan.bga<-bga(khan$train, khan$train.classes)
if (require(ade4, quiet = TRUE)) {
khan.bga<-bga.suppl(khan$train, supdata=khan$test, classvec=khan$train.classes,
supvec=khan$test.classes)
khan.bga
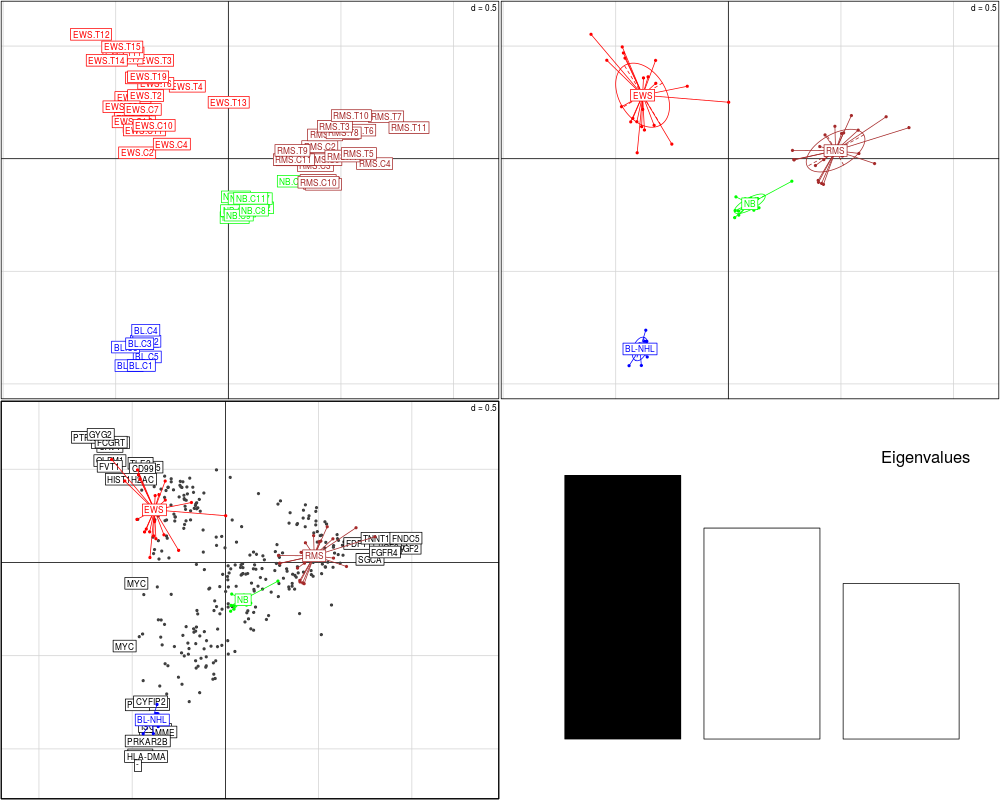
plot.bga(khan.bga, genelabels=khan$annotation$Symbol)
khan.bga$suppl
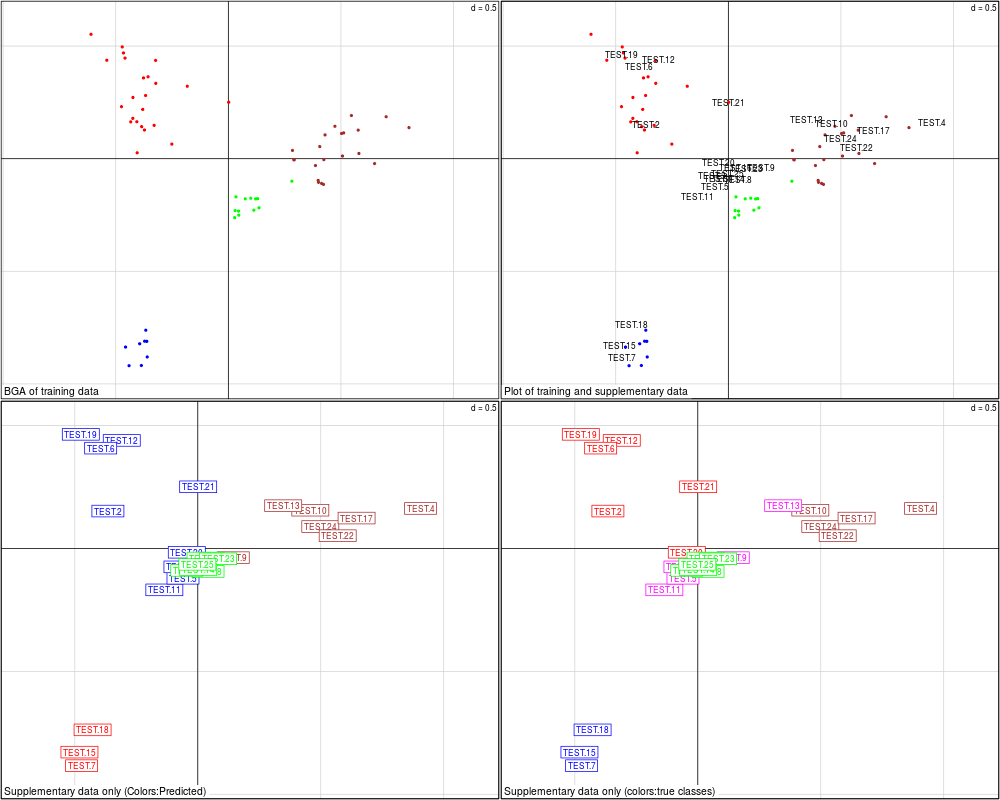
plot.suppl(khan.bga$suppl, khan.bga)
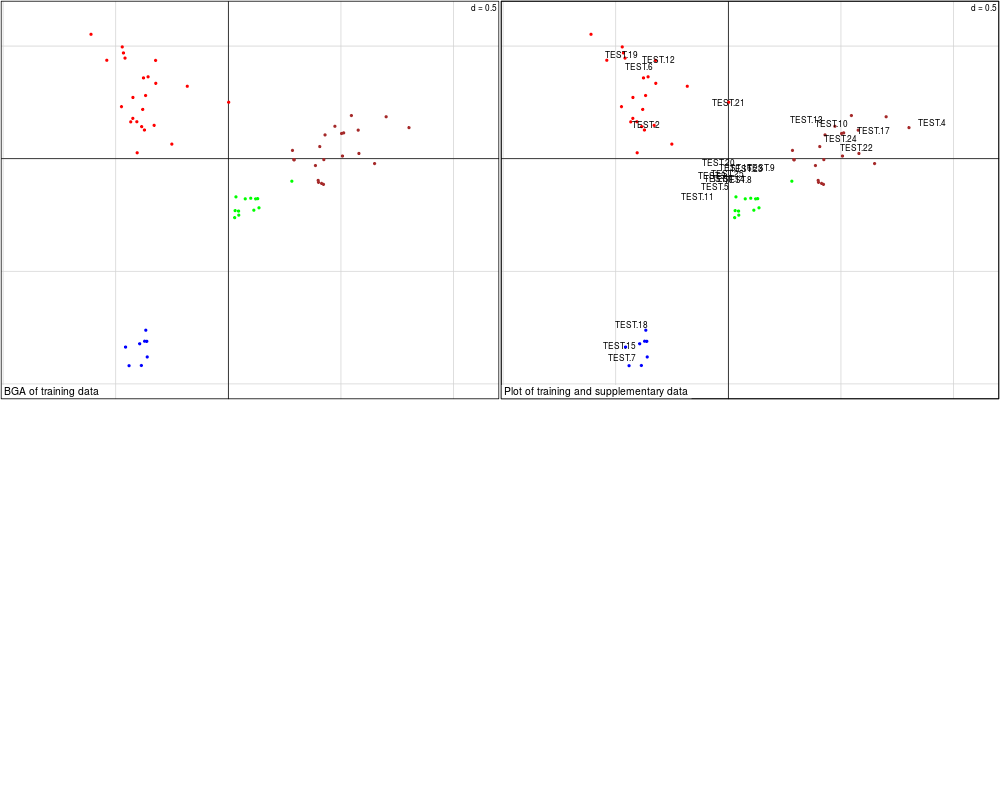
plot.suppl(khan.bga$suppl, khan.bga, supvec=NULL, supvec.pred=NULL)
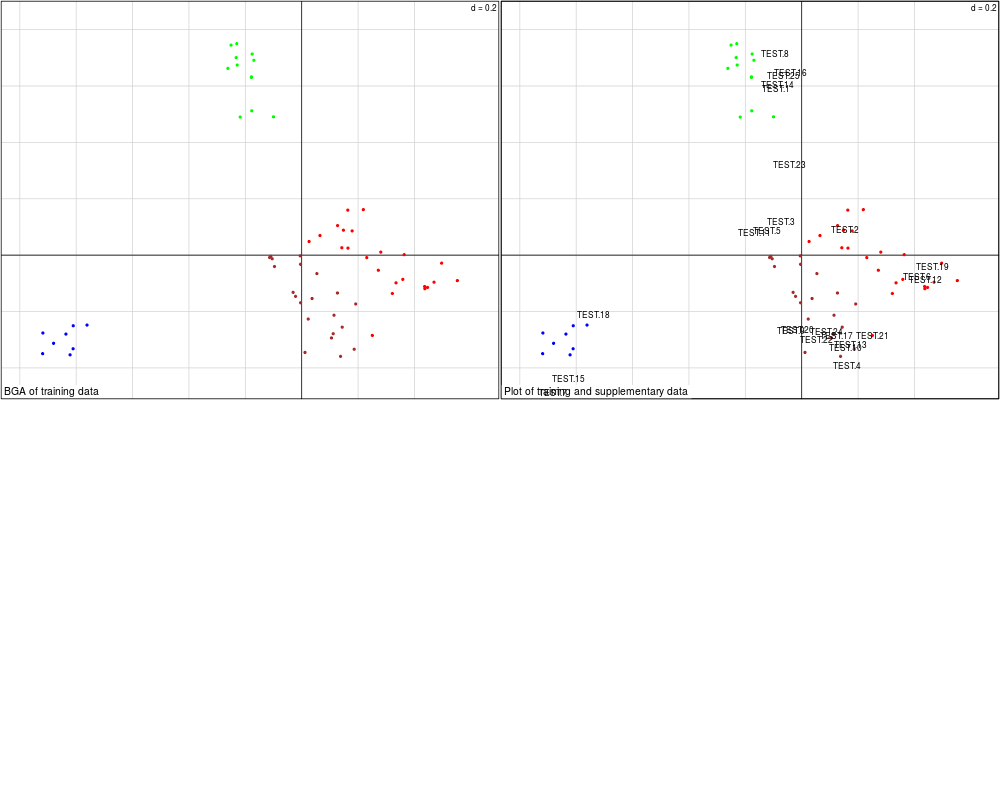
plot.suppl(khan.bga$suppl, khan.bga, axis1=2, axis2=3,supvec=NULL, supvec.pred=NULL)
}
Results
R version 3.3.1 (2016-06-21) -- "Bug in Your Hair"
Copyright (C) 2016 The R Foundation for Statistical Computing
Platform: x86_64-pc-linux-gnu (64-bit)

R is free software and comes with ABSOLUTELY NO WARRANTY.
You are welcome to redistribute it under certain conditions.
Type 'license()' or 'licence()' for distribution details.

R is a collaborative project with many contributors.
Type 'contributors()' for more information and
'citation()' on how to cite R or R packages in publications.

Type 'demo()' for some demos, 'help()' for on-line help, or
'help.start()' for an HTML browser interface to help.
Type 'q()' to quit R.

> library(made4)
Loading required package: ade4
Loading required package: RColorBrewer
Loading required package: gplots

Attaching package: 'gplots'

The following object is masked from 'package:stats':

    lowess

Loading required package: scatterplot3d
> png(filename="/home/ddbj/snapshot/RGM3/R_BC/result/made4/suppl.Rd_%03d_medium.png", width=480, height=480)
> ### Name: suppl
> ### Title: Projection of supplementary data onto axes from a between group
> ###   analysis
> ### Aliases: suppl plot.suppl
> ### Keywords: manip multivariate
>
> ### ** Examples
>
> data(khan)
> #khan.bga<-bga(khan$train, khan$train.classes)
> if (require(ade4, quiet = TRUE)) {
+ khan.bga<-bga.suppl(khan$train, supdata=khan$test, classvec=khan$train.classes,
+           supvec=khan$test.classes)
+
+ khan.bga
+ plot.bga(khan.bga, genelabels=khan$annotation$Symbol)
+ khan.bga$suppl
+
+ plot.suppl(khan.bga$suppl, khan.bga)
+ plot.suppl(khan.bga$suppl, khan.bga, supvec=NULL, supvec.pred=NULL)
+ plot.suppl(khan.bga$suppl, khan.bga, axis1=2, axis2=3,supvec=NULL, supvec.pred=NULL)
+ }
[1] "Need to specify groups"
[1] "Need to specify groups"
[1] "Need to specify groups"
>
>
>
>
>
> dev.off()
null device
          1
>
|