Supported by Dr. Osamu Ogasawara and  . . |
|
Last data update: 2014.03.03 |
Method boxplot for objects defined in this packageDescriptionGeneric function Usage## S3 method for class 'maigesRaw' boxplot(x, ...) ## S3 method for class 'maiges' boxplot(x, name=NULL, gLabelID=NULL, sLabelID=NULL, gSamples=NULL, ...) ## S3 method for class 'maigesANOVA' boxplot(x, name=NULL, gLabelID=NULL, sLabelID=NULL, gSamples=NULL, ...) ## S3 method for class 'maigesDEcluster' boxplot(x, name=NULL, gLabelID=NULL, sLabelID=NULL, gSamples=NULL, ...) Arguments
DetailsThis method uses the function If you especify the Author(s)Gustavo H. Esteves <gesteves@vision.ime.usp.br> See Also
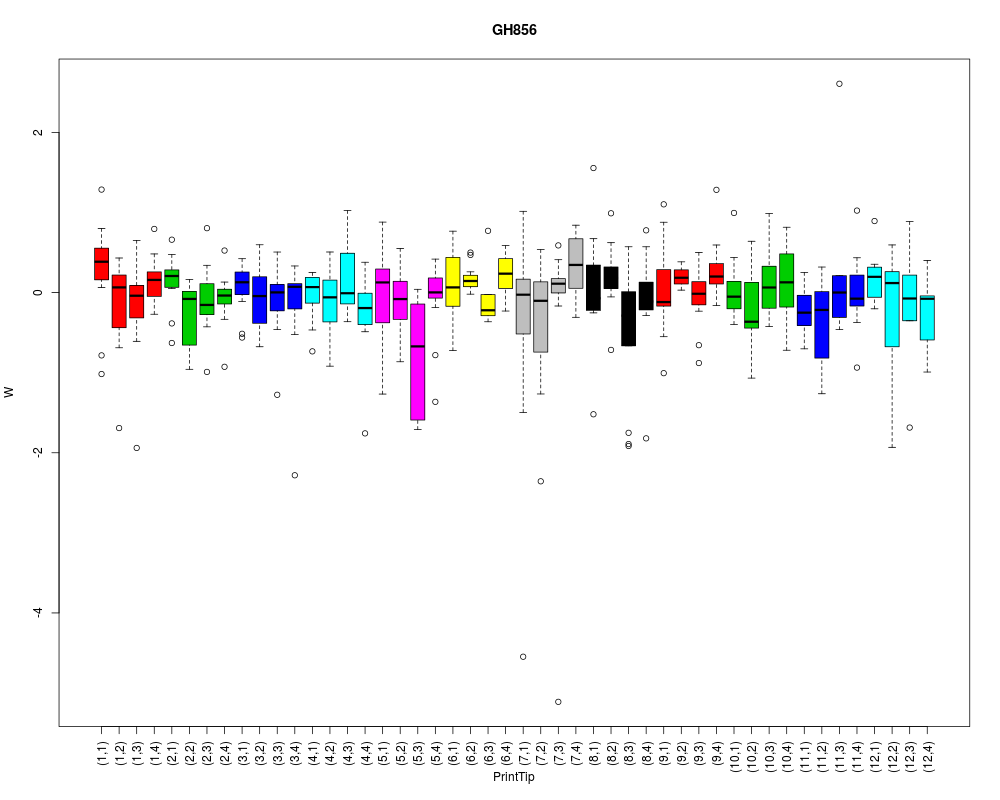
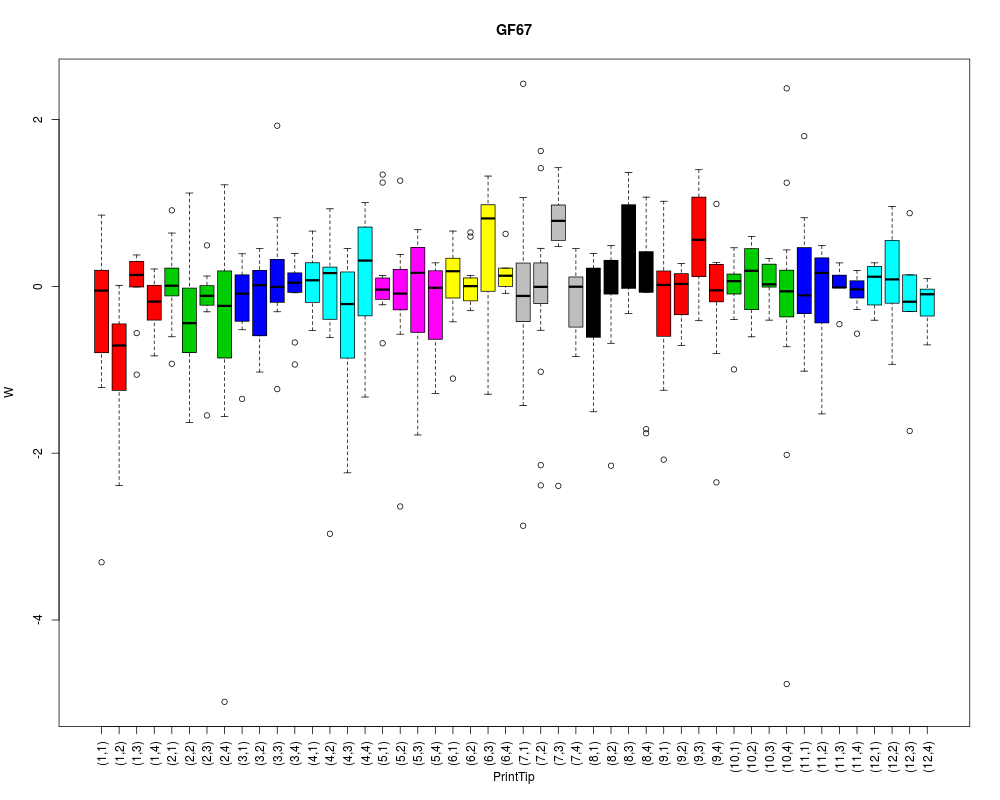
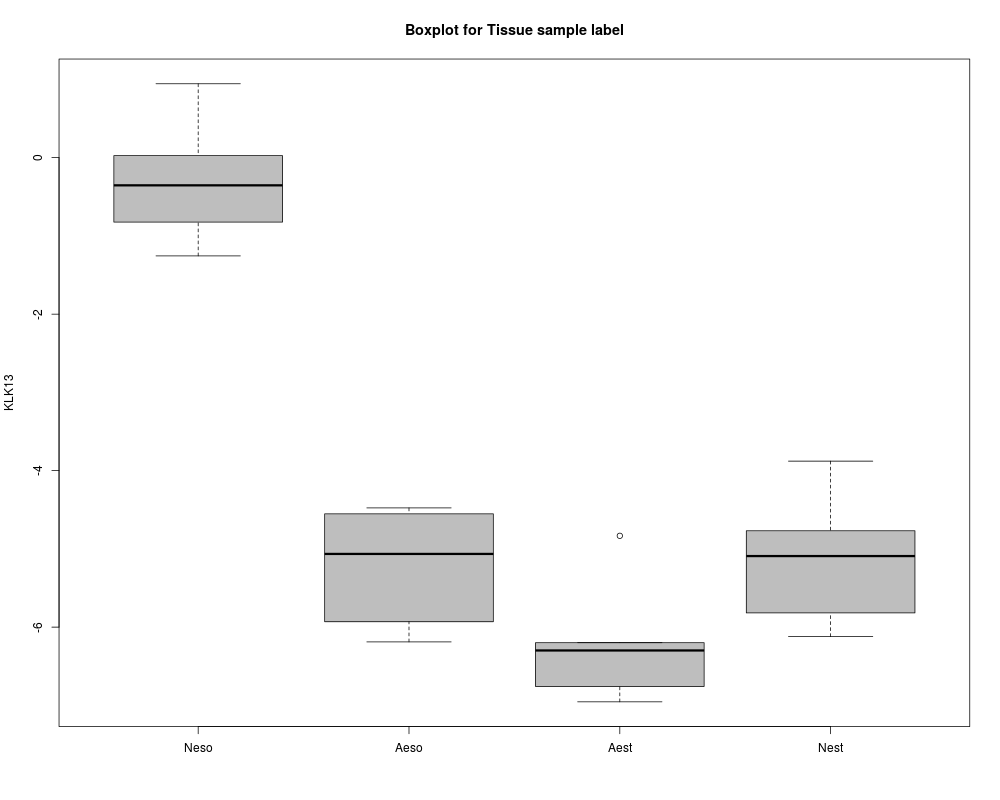
Examples## Loading the dataset data(gastro) ## To see the boxplots for W values in all chips boxplot(gastro.raw) ## maigesRaw class boxplot(gastro.norm) ## maigesNorm class boxplot(gastro.summ) ## summarized data (also maigesNorm class) ## To see the boxplots for W values in individual chips ## separating into print tips. boxplot(gastro.raw[,1]) ## maigesRaw class, first chip boxplot(gastro.norm[,8]) ## maigesNorm class, 8th chip boxplot(gastro.summ[,19]) ## summarized data (also maigesNorm class), 19th chip ## Boxplot for individual genes into ANOVA model fitting gastro.ANOVA = designANOVA(gastro.summ, factors="Tissue") gastro.ANOVAfit = deGenesANOVA(gastro.ANOVA, retF=TRUE) boxplot(gastro.ANOVAfit, name="KLK13", gLabelID="GeneName", sLabelID="Tissue") Results
R version 3.3.1 (2016-06-21) -- "Bug in Your Hair"
Copyright (C) 2016 The R Foundation for Statistical Computing
Platform: x86_64-pc-linux-gnu (64-bit)
R is free software and comes with ABSOLUTELY NO WARRANTY.
You are welcome to redistribute it under certain conditions.
Type 'license()' or 'licence()' for distribution details.
R is a collaborative project with many contributors.
Type 'contributors()' for more information and
'citation()' on how to cite R or R packages in publications.
Type 'demo()' for some demos, 'help()' for on-line help, or
'help.start()' for an HTML browser interface to help.
Type 'q()' to quit R.
> library(maigesPack)
Loading required package: convert
Loading required package: Biobase
Loading required package: BiocGenerics
Loading required package: parallel
Attaching package: 'BiocGenerics'
The following objects are masked from 'package:parallel':
clusterApply, clusterApplyLB, clusterCall, clusterEvalQ,
clusterExport, clusterMap, parApply, parCapply, parLapply,
parLapplyLB, parRapply, parSapply, parSapplyLB
The following objects are masked from 'package:stats':
IQR, mad, xtabs
The following objects are masked from 'package:base':
Filter, Find, Map, Position, Reduce, anyDuplicated, append,
as.data.frame, cbind, colnames, do.call, duplicated, eval, evalq,
get, grep, grepl, intersect, is.unsorted, lapply, lengths, mapply,
match, mget, order, paste, pmax, pmax.int, pmin, pmin.int, rank,
rbind, rownames, sapply, setdiff, sort, table, tapply, union,
unique, unsplit
Welcome to Bioconductor
Vignettes contain introductory material; view with
'browseVignettes()'. To cite Bioconductor, see
'citation("Biobase")', and for packages 'citation("pkgname")'.
Loading required package: limma
Attaching package: 'limma'
The following object is masked from 'package:BiocGenerics':
plotMA
Loading required package: marray
Loading required package: graph
> png(filename="/home/ddbj/snapshot/RGM3/R_BC/result/maigesPack/boxplot-methods.Rd_%03d_medium.png", width=480, height=480)
> ### Name: boxplot
> ### Title: Method boxplot for objects defined in this package
> ### Aliases: boxplot.maigesRaw boxplot.maiges boxplot.maigesANOVA
> ### boxplot.maigesDEcluster boxplot
> ### Keywords: array
>
> ### ** Examples
>
> ## Loading the dataset
> data(gastro)
>
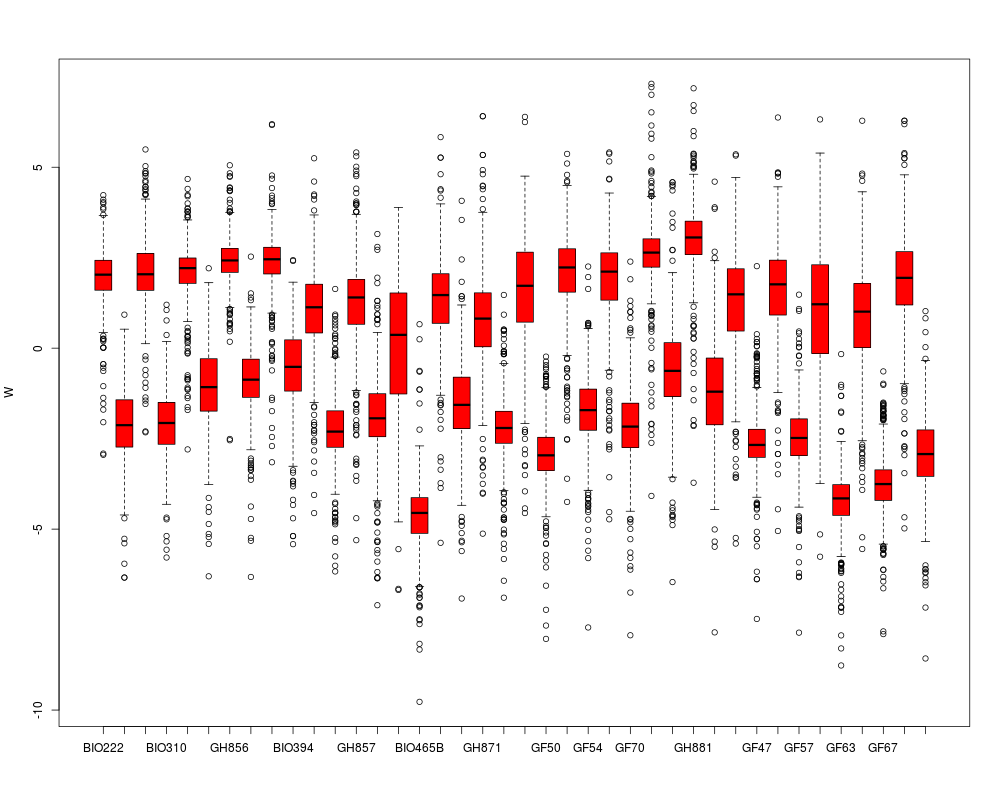
> ## To see the boxplots for W values in all chips
> boxplot(gastro.raw) ## maigesRaw class
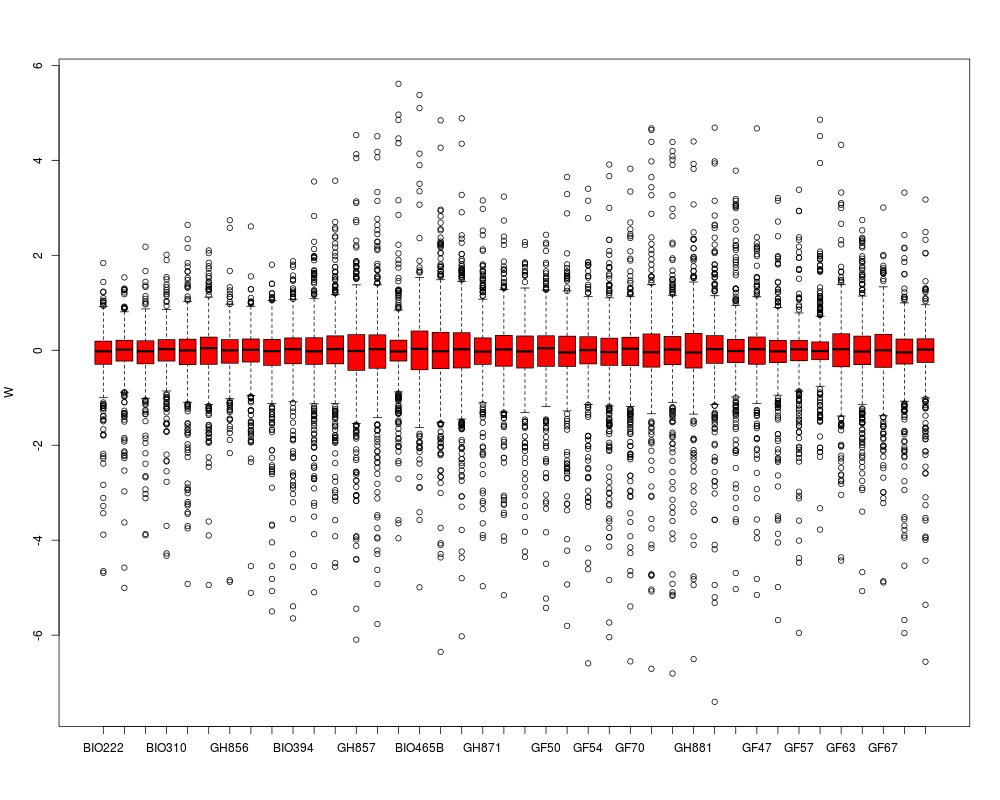
> boxplot(gastro.norm) ## maigesNorm class
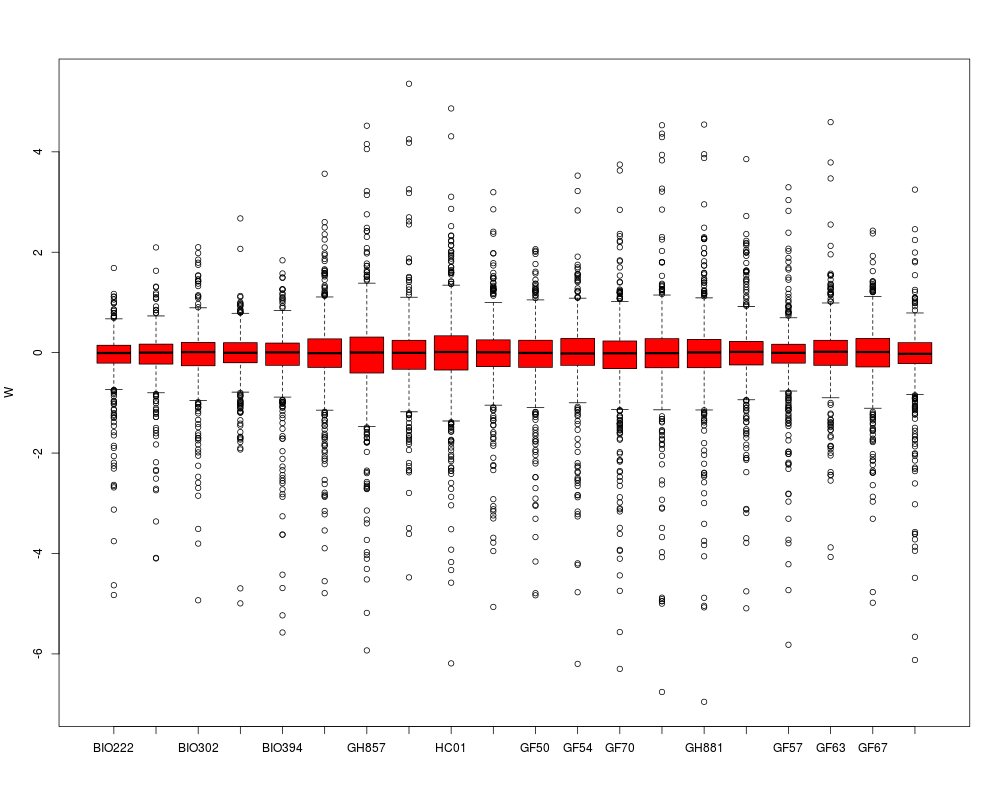
> boxplot(gastro.summ) ## summarized data (also maigesNorm class)
>
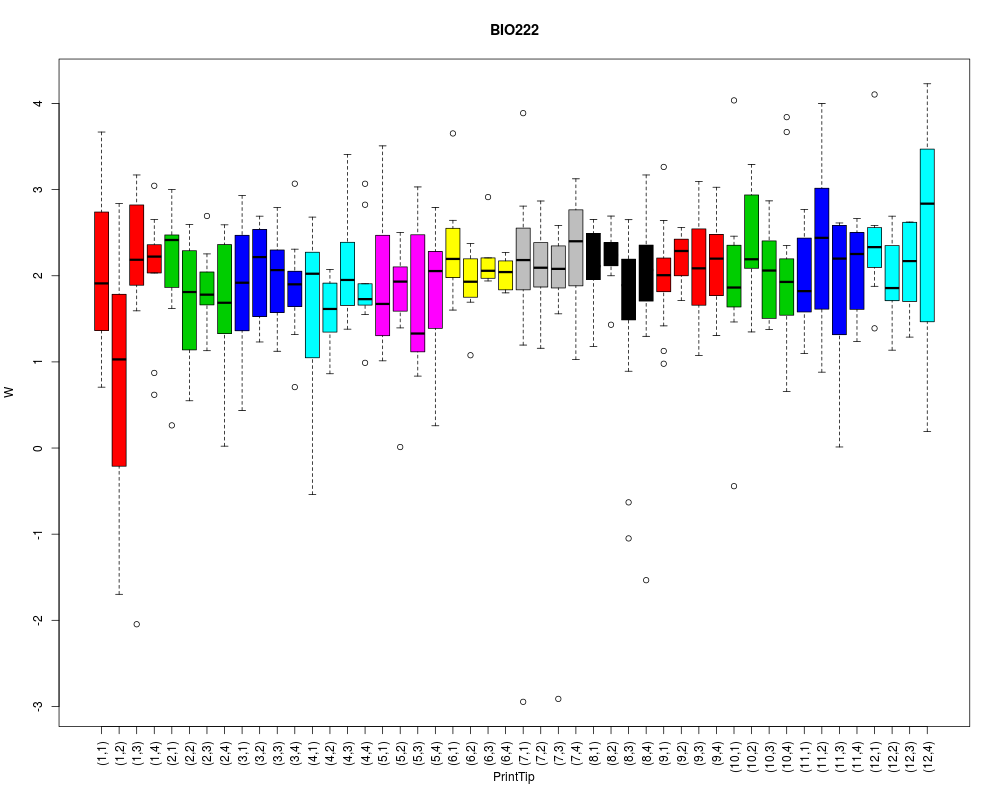
> ## To see the boxplots for W values in individual chips
> ## separating into print tips.
> boxplot(gastro.raw[,1]) ## maigesRaw class, first chip
> boxplot(gastro.norm[,8]) ## maigesNorm class, 8th chip
> boxplot(gastro.summ[,19]) ## summarized data (also maigesNorm class), 19th chip
>
>
> ## Boxplot for individual genes into ANOVA model fitting
> gastro.ANOVA = designANOVA(gastro.summ, factors="Tissue")
> gastro.ANOVAfit = deGenesANOVA(gastro.ANOVA, retF=TRUE)
>
> boxplot(gastro.ANOVAfit, name="KLK13", gLabelID="GeneName",
+ sLabelID="Tissue")
>
>
>
>
>
> dev.off()
null device
1
>
|