Supported by Dr. Osamu Ogasawara and  . . |
|
Last data update: 2014.03.03 |
Function to do hierarchical cluster analysisDescriptionThis is a function to do hierarchical clustering
analysis for objects of classes Usage
hierM(data, group=c("C", "R", "B")[1], distance="correlation",
      method="complete", doHeat=TRUE, sLabelID="SAMPLE",
      gLabelID="GeneName", rmGenes=NULL, rmSamples=NULL,
      rmBad=TRUE, geneGrp=NULL, path=NULL, ...)
Arguments
DetailsThis function implements the hierarchical clustering method for
objects of microarray data defined in this package. The default
function for hierarchical clustering is the
ValueThis function display the heatmaps and don't return any object or value. Author(s)Gustavo H. Esteves <gesteves@vision.ime.usp.br> See Also
Examples
## Loading the dataset
data(gastro)

## Doing a hierarchical cluster using all genes, for maigesRaw class
hierM(gastro.raw, rmGenes=c("BLANK","DAP","LYS","PHE", "Q_GENE","THR","TRP"),
      sLabelID="Sample", gLabelID="Name", doHeat=FALSE)

## Doing a hierarchical cluster using all genes, for maigesNorm class
hierM(gastro.norm, rmGenes=c("BLANK","DAP","LYS","PHE", "Q_GENE","THR","TRP"),
      sLabelID="Sample", gLabelID="Name", doHeat=FALSE)

## If you want to show the heatmap do
hierM(gastro.norm, rmGenes=c("BLANK","DAP","LYS","PHE", "Q_GENE","THR","TRP"),
      sLabelID="Sample", gLabelID="Name", doHeat=TRUE)

## If you want to show the hierarchical branch in both margins do
hierM(gastro.summ, rmGenes=c("BLANK","DAP","LYS","PHE", "Q_GENE","THR","TRP"),
      sLabelID="Sample", gLabelID="Name", doHeat=TRUE, group="B")

## If you want to use euclidean distance only into rows (spots or genes)
hierM(gastro.summ, rmGenes=c("BLANK","DAP","LYS","PHE", "Q_GENE","THR","TRP"),
      sLabelID="Sample", gLabelID="Name", doHeat=FALSE, group="R", distance="euclidean")
Results
R version 3.3.1 (2016-06-21) -- "Bug in Your Hair"
Copyright (C) 2016 The R Foundation for Statistical Computing
Platform: x86_64-pc-linux-gnu (64-bit)
R is free software and comes with ABSOLUTELY NO WARRANTY.
You are welcome to redistribute it under certain conditions.
Type 'license()' or 'licence()' for distribution details.
R is a collaborative project with many contributors.
Type 'contributors()' for more information and
'citation()' on how to cite R or R packages in publications.
Type 'demo()' for some demos, 'help()' for on-line help, or
'help.start()' for an HTML browser interface to help.
Type 'q()' to quit R.
> library(maigesPack)
Loading required package: convert
Loading required package: Biobase
Loading required package: BiocGenerics
Loading required package: parallel
Attaching package: 'BiocGenerics'
The following objects are masked from 'package:parallel':
clusterApply, clusterApplyLB, clusterCall, clusterEvalQ,
clusterExport, clusterMap, parApply, parCapply, parLapply,
parLapplyLB, parRapply, parSapply, parSapplyLB
The following objects are masked from 'package:stats':
IQR, mad, xtabs
The following objects are masked from 'package:base':
Filter, Find, Map, Position, Reduce, anyDuplicated, append,
as.data.frame, cbind, colnames, do.call, duplicated, eval, evalq,
get, grep, grepl, intersect, is.unsorted, lapply, lengths, mapply,
match, mget, order, paste, pmax, pmax.int, pmin, pmin.int, rank,
rbind, rownames, sapply, setdiff, sort, table, tapply, union,
unique, unsplit
Welcome to Bioconductor
Vignettes contain introductory material; view with
'browseVignettes()'. To cite Bioconductor, see
'citation("Biobase")', and for packages 'citation("pkgname")'.
Loading required package: limma
Attaching package: 'limma'
The following object is masked from 'package:BiocGenerics':
plotMA
Loading required package: marray
Loading required package: graph
> png(filename="/home/ddbj/snapshot/RGM3/R_BC/result/maigesPack/hierM.Rd_%03d_medium.png", width=480, height=480)
> ### Name: hierM
> ### Title: Function to do hierarchical cluster analysis
> ### Aliases: hierM
> ### Keywords: hplot
>
> ### ** Examples
>
> ## Loading the dataset
> data(gastro)
>
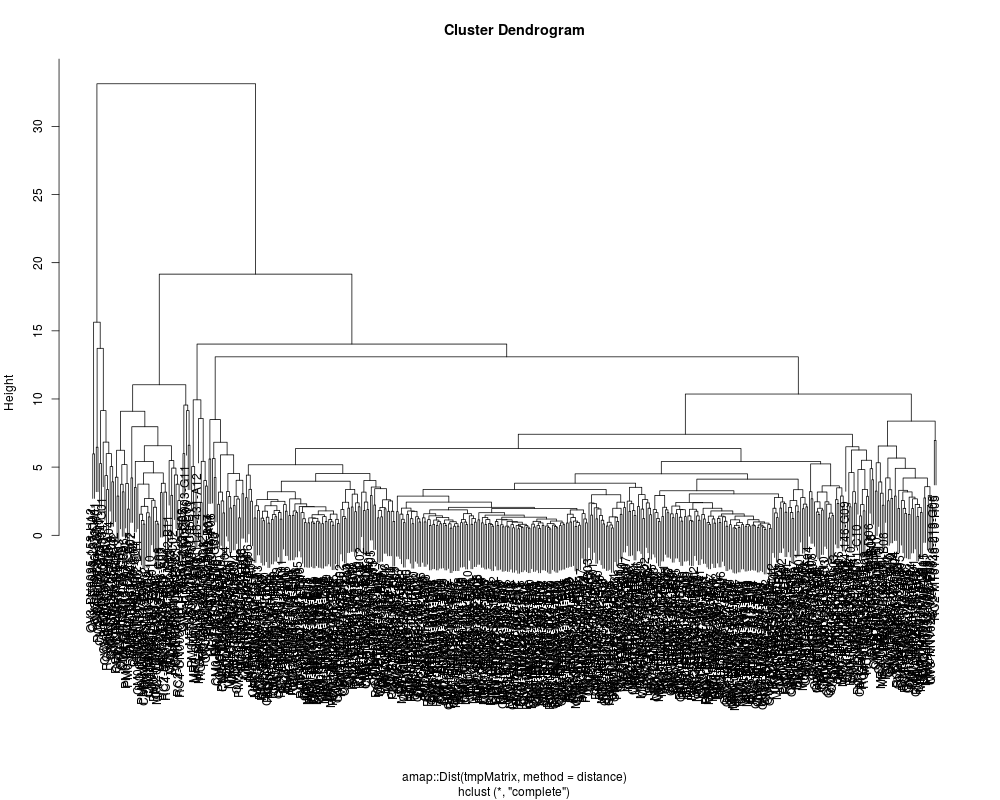
> ## Doing a hierarchical cluster using all genes, for maigesRaw class
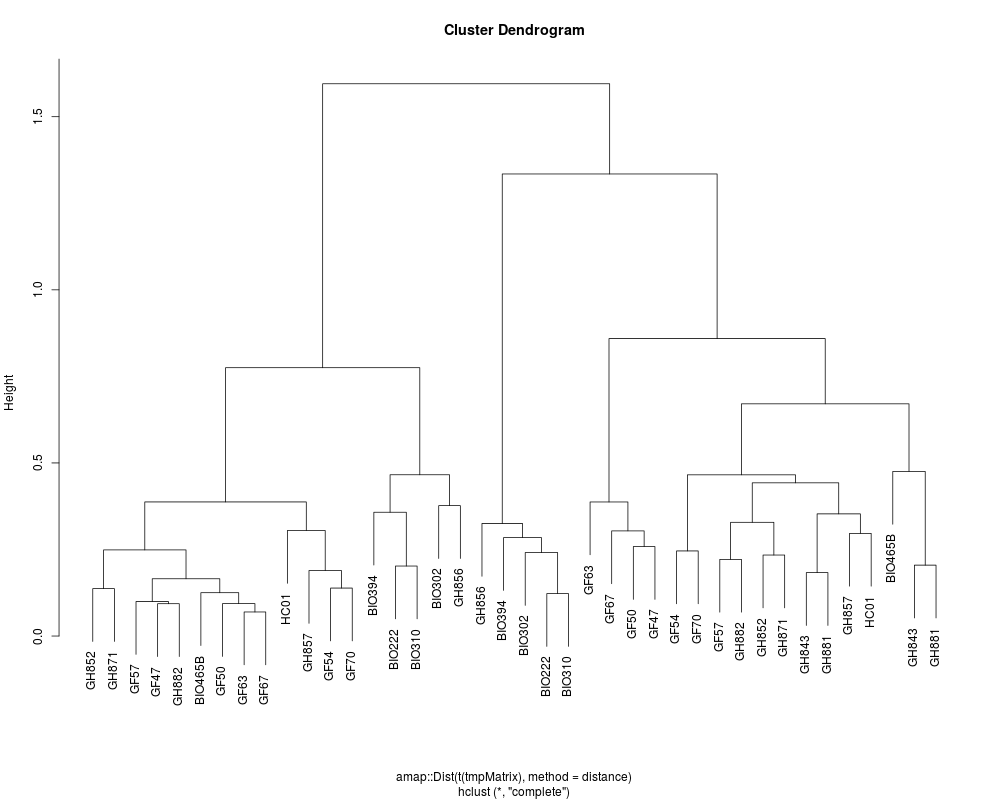
> hierM(gastro.raw, rmGenes=c("BLANK","DAP","LYS","PHE", "Q_GENE","THR","TRP"),
+ sLabelID="Sample", gLabelID="Name", doHeat=FALSE)
Warning message:
In as.matrix(log2(tmp1$R)) : NaNs produced
>
> ## Doing a hierarchical cluster using all genes, for maigesNorm class
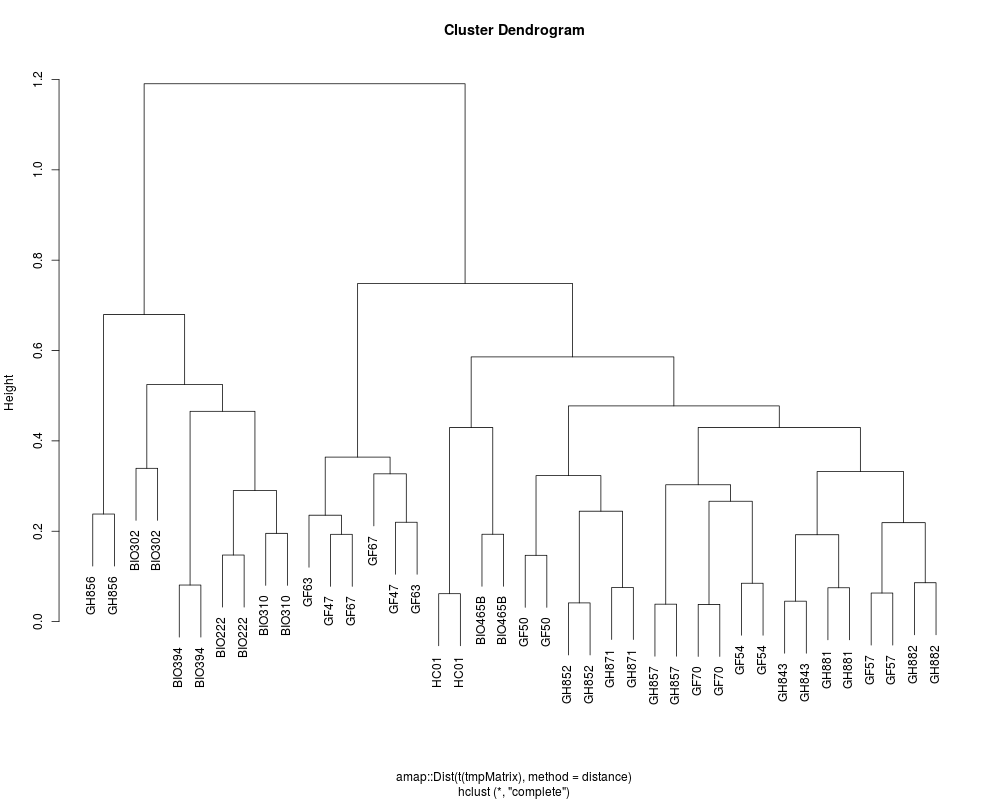
> hierM(gastro.norm, rmGenes=c("BLANK","DAP","LYS","PHE", "Q_GENE","THR","TRP"),
+ sLabelID="Sample", gLabelID="Name", doHeat=FALSE)
>
> ## If you want to show the heatmap do
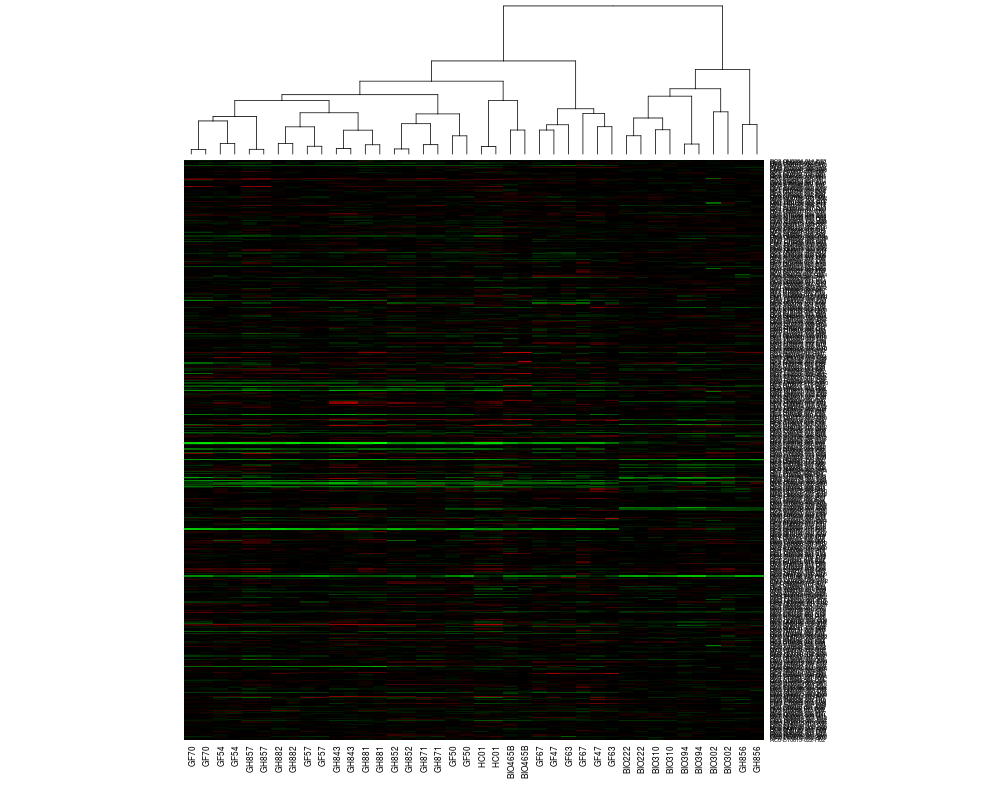
> hierM(gastro.norm, rmGenes=c("BLANK","DAP","LYS","PHE", "Q_GENE","THR","TRP"),
+ sLabelID="Sample", gLabelID="Name", doHeat=TRUE)
>
> ## If you want to show the hierarchical branch in both margins do
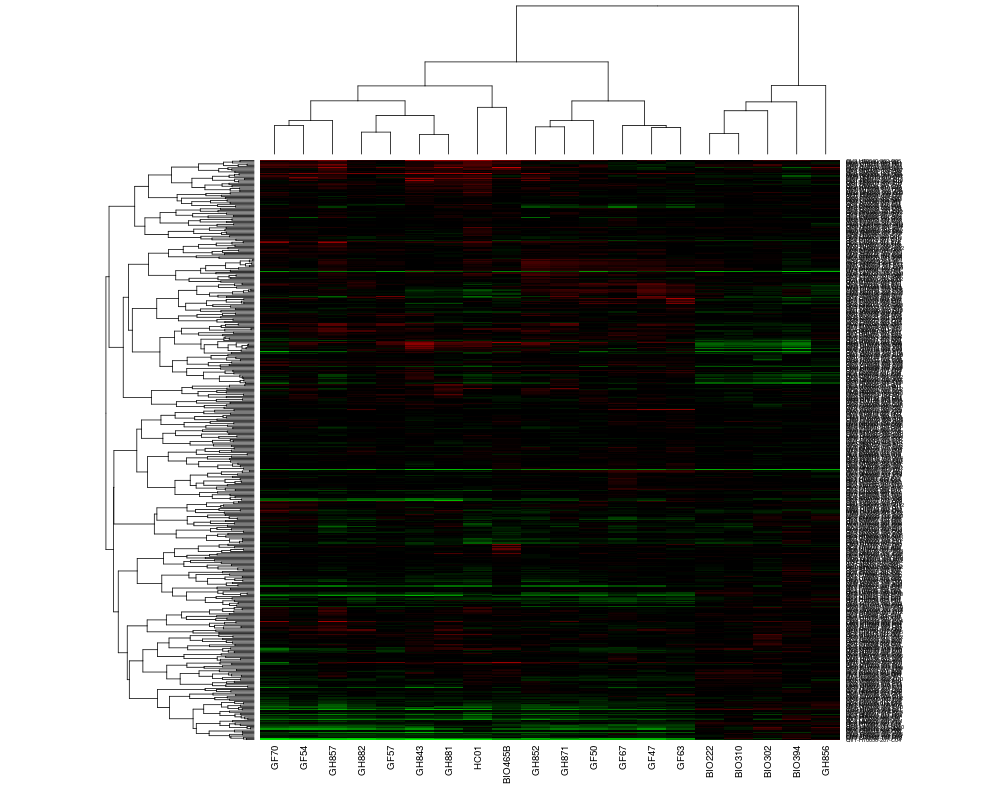
> hierM(gastro.summ, rmGenes=c("BLANK","DAP","LYS","PHE", "Q_GENE","THR","TRP"),
+ sLabelID="Sample", gLabelID="Name", doHeat=TRUE, group="B")
>
> ## If you want to use euclidean distance only into rows (spots or genes)
> hierM(gastro.summ, rmGenes=c("BLANK","DAP","LYS","PHE", "Q_GENE","THR","TRP"),
+ sLabelID="Sample", gLabelID="Name", doHeat=FALSE, group="R", distance="euclidean")
>
>
>
>
>
> dev.off()
null device
1
>
|