Supported by Dr. Osamu Ogasawara and  . . |
|
Last data update: 2014.03.03 |
Function to do k-means cluster analysisDescriptionThis is a function to do k-means clustering
analysis for objects of classes Usage
kmeansM(data, group=c("C", "R")[1], distance="correlation",
        method="complete", sampleT=NULL, doHier=FALSE, sLabelID="SAMPLE",
        gLabelID="GeneName", rmGenes=NULL, rmSamples=NULL, rmBad=TRUE,
        geneGrp=NULL, path=NULL, ...)
Arguments
DetailsThis function implements the k-means clustering method for
objects of microarray data defined in this package. The method uses
the function ValueThis function display the heatmaps and return invisibly a list
resulted from the function Author(s)Gustavo H. Esteves <gesteves@vision.ime.usp.br> See Also
Examples
## Loading the dataset
data(gastro)
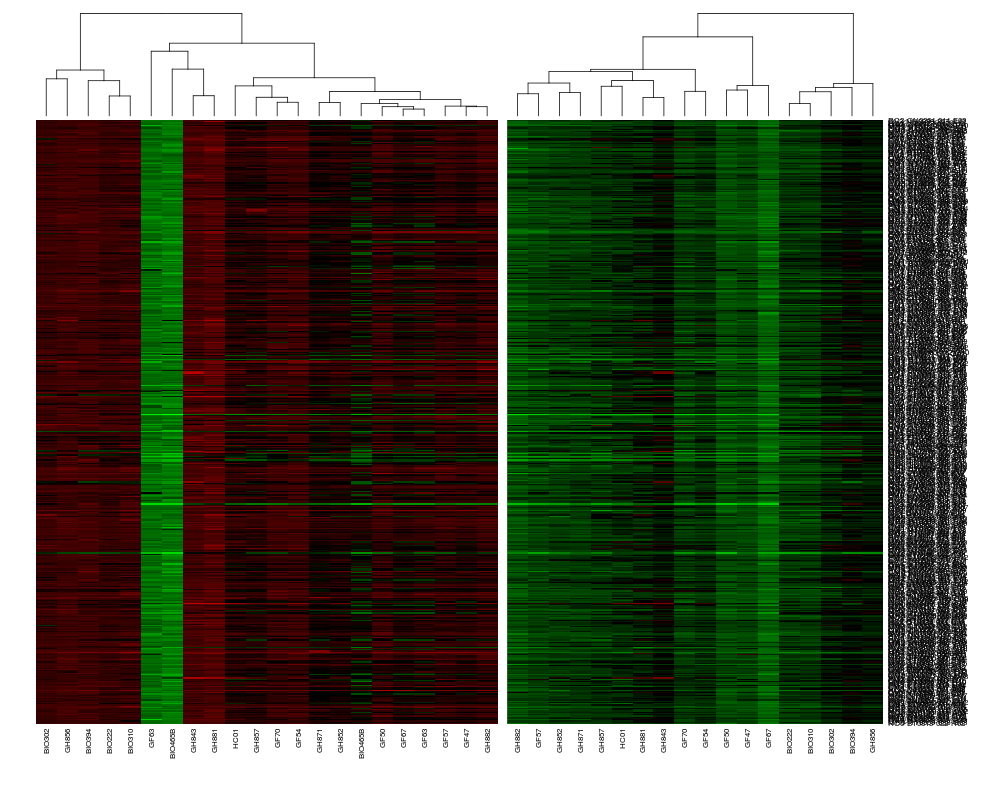
## Doing a K-means cluster with 2 groups using all genes, for maigesRaw class
kmeansM(gastro.raw, rmGenes=c("BLANK","DAP","LYS","PHE", "Q_GENE","THR","TRP"),
sLabelID="Sample", gLabelID="Name", centers=2)
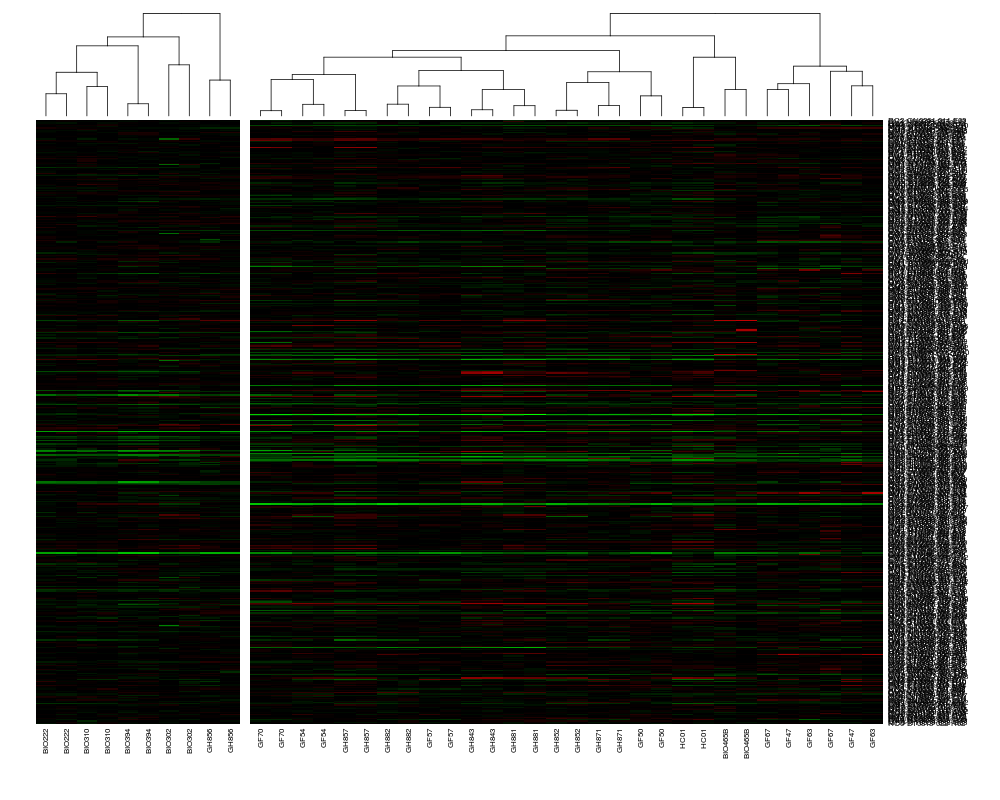
## The same as above, but for maigesNorm class
kmeansM(gastro.norm, rmGenes=c("BLANK","DAP","LYS","PHE", "Q_GENE","THR","TRP"),
sLabelID="Sample", gLabelID="Name", centers=2)
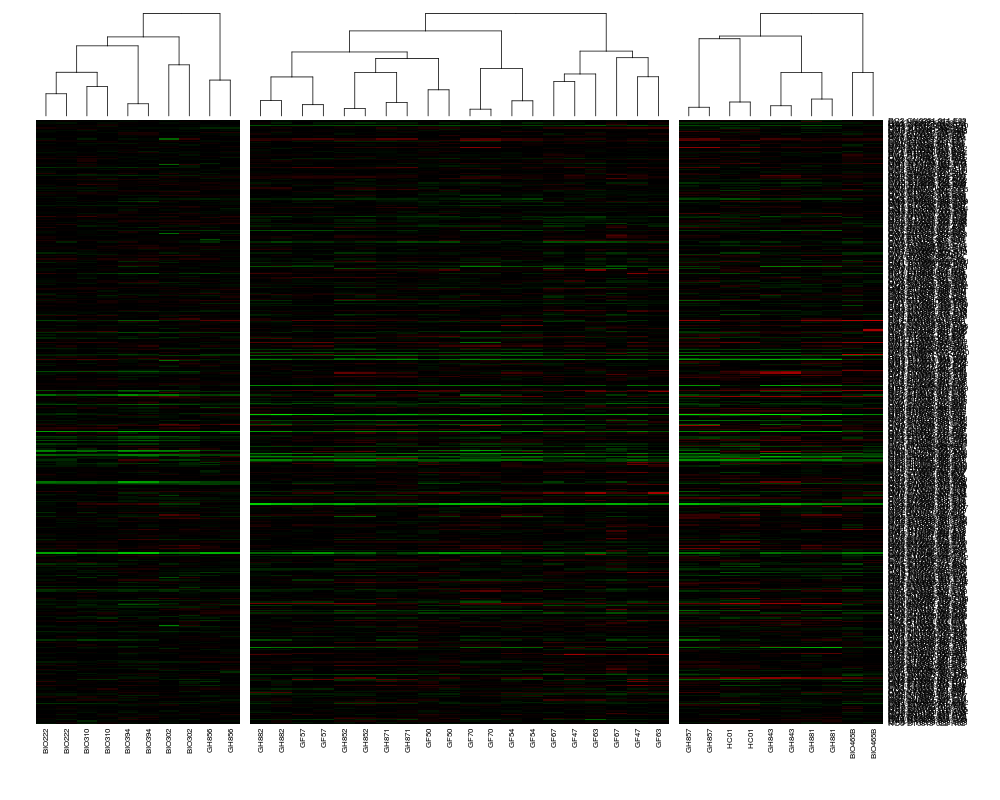
## Another example with 3 groups
kmeansM(gastro.norm, rmGenes=c("BLANK","DAP","LYS","PHE", "Q_GENE","THR","TRP"),
sLabelID="Sample", gLabelID="Name", centers=3)
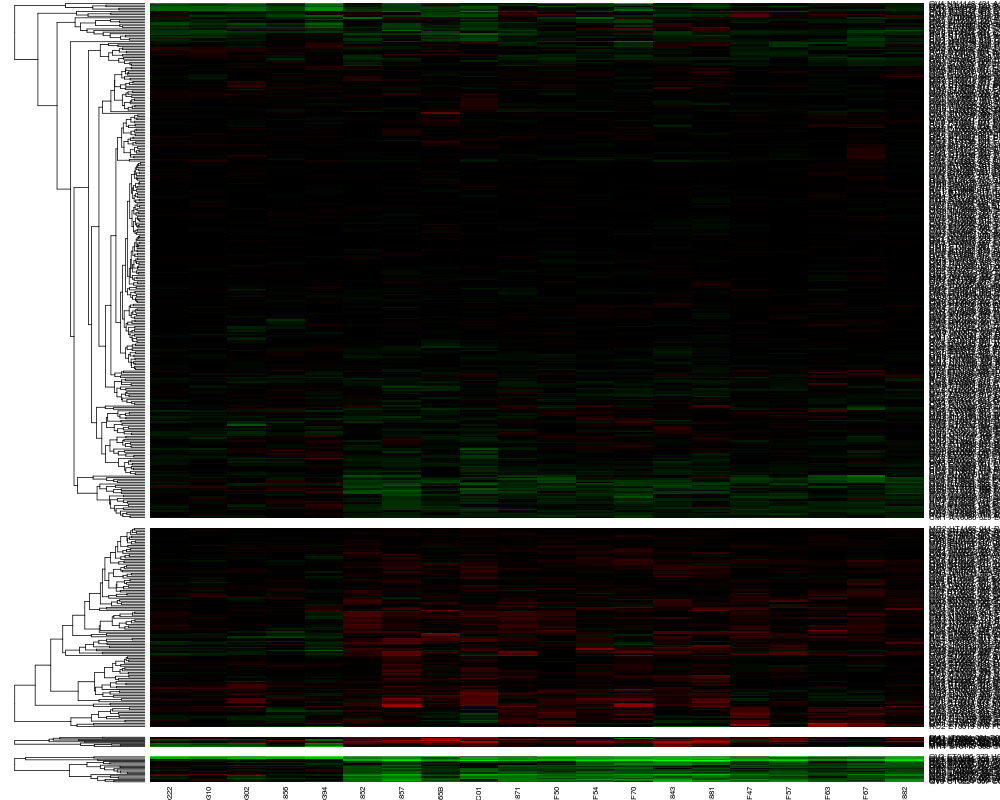
## If you want to use euclidean distance to group genes (or spots) with
## 4 groups
kmeansM(gastro.summ, rmGenes=c("BLANK","DAP","LYS","PHE", "Q_GENE","THR","TRP"),
sLabelID="Sample", gLabelID="Name", centers=4, group="R", distance="euclidean")
Results
R version 3.3.1 (2016-06-21) -- "Bug in Your Hair"
Copyright (C) 2016 The R Foundation for Statistical Computing
Platform: x86_64-pc-linux-gnu (64-bit)

R is free software and comes with ABSOLUTELY NO WARRANTY.
You are welcome to redistribute it under certain conditions.
Type 'license()' or 'licence()' for distribution details.

R is a collaborative project with many contributors.
Type 'contributors()' for more information and
'citation()' on how to cite R or R packages in publications.

Type 'demo()' for some demos, 'help()' for on-line help, or
'help.start()' for an HTML browser interface to help.
Type 'q()' to quit R.

> library(maigesPack)
Loading required package: convert
Loading required package: Biobase
Loading required package: BiocGenerics
Loading required package: parallel

Attaching package: 'BiocGenerics'

The following objects are masked from 'package:parallel':

    clusterApply, clusterApplyLB, clusterCall, clusterEvalQ,
    clusterExport, clusterMap, parApply, parCapply, parLapply,
    parLapplyLB, parRapply, parSapply, parSapplyLB

The following objects are masked from 'package:stats':

    IQR, mad, xtabs

The following objects are masked from 'package:base':

    Filter, Find, Map, Position, Reduce, anyDuplicated, append,
    as.data.frame, cbind, colnames, do.call, duplicated, eval, evalq,
    get, grep, grepl, intersect, is.unsorted, lapply, lengths, mapply,
    match, mget, order, paste, pmax, pmax.int, pmin, pmin.int, rank,
    rbind, rownames, sapply, setdiff, sort, table, tapply, union,
    unique, unsplit

Welcome to Bioconductor

    Vignettes contain introductory material; view with
    'browseVignettes()'. To cite Bioconductor, see
    'citation("Biobase")', and for packages 'citation("pkgname")'.

Loading required package: limma

Attaching package: 'limma'

The following object is masked from 'package:BiocGenerics':

    plotMA

Loading required package: marray
Loading required package: graph
> png(filename="/home/ddbj/snapshot/RGM3/R_BC/result/maigesPack/kmeansM.Rd_%03d_medium.png", width=480, height=480)
> ### Name: kmeansM
> ### Title: Function to do k-means cluster analysis
> ### Aliases: kmeansM
> ### Keywords: hplot
>
> ### ** Examples
>
> ## Loading the dataset
> data(gastro)
>
> ## Doing a K-means cluster with 2 groups using all genes, for maigesRaw class
> kmeansM(gastro.raw, rmGenes=c("BLANK","DAP","LYS","PHE", "Q_GENE","THR","TRP"),
+         sLabelID="Sample", gLabelID="Name", centers=2)
Warning message:
In as.matrix(log2(tmp1$R)) : NaNs produced
>
> ## The same as above, but for maigesNorm class
> kmeansM(gastro.norm, rmGenes=c("BLANK","DAP","LYS","PHE", "Q_GENE","THR","TRP"),
+         sLabelID="Sample", gLabelID="Name", centers=2)
>
> ## Another example with 3 groups
> kmeansM(gastro.norm, rmGenes=c("BLANK","DAP","LYS","PHE", "Q_GENE","THR","TRP"),
+         sLabelID="Sample", gLabelID="Name", centers=3)
>
> ## If you want to use euclidean distance to group genes (or spots) with
> ## 4 groups
> kmeansM(gastro.summ, rmGenes=c("BLANK","DAP","LYS","PHE", "Q_GENE","THR","TRP"),
+         sLabelID="Sample", gLabelID="Name", centers=4, group="R", distance="euclidean")
Warning message:
did not converge in 10 iterations
>
>
>
>
>
> dev.off()
null device
          1
>
|