Supported by Dr. Osamu Ogasawara and  . . |
|
Last data update: 2014.03.03 |
Method plot for objects defined in this packageDescriptionGeneric function Usage
## S3 method for class 'maigesRaw'
plot(x, bkgSub="subtract", z=NULL, legend.func=NULL,
    ylab="W", ...)

## S3 method for class 'maiges'
plot(x, z=NULL, legend.func=NULL, ylab="W", ...)

## S3 method for class 'maigesANOVA'
plot(x, z=NULL, legend.func=NULL, ylab="W", ...)

## S3 method for class 'maigesDE'
plot(x, adjP="none", idx=1, ...)

## S3 method for class 'maigesDEcluster'
plot(x, adjP="none", idx=1, ...)

## S3 method for class 'maigesClass'
plot(x, idx=1, ...)

## S3 method for class 'maigesRelNetB'
plot(x=NULL, cutPval=0.05, cutCor=NULL,
name=NULL, ...)

## S3 method for class 'maigesRelNetM'
plot(x=NULL, cutPval=0.05, names=NULL, ...)

## S3 method for class 'maigesActMod'
plot(x, type=c("S", "C")[2], keepEmpty=FALSE, ...)

## S3 method for class 'maigesActNet'
plot(x, type=c("score", "p-value")[1], ...)
Arguments
DetailsThis method uses the function Pay attention that, even using the method Author(s)Gustavo H. Esteves <gesteves@vision.ime.usp.br> See Also
Examples## Loading the dataset data(gastro) ## Example with an object of class maigesRaw, without and with backgound ## subtraction, also we present a plot with normexp (from limma package) ## subtract algorithm. plot(gastro.raw[,1], bkgSub="none") plot(gastro.raw[,1], bkgSub="subtract") plot(gastro.raw[,1], bkgSub="normexp") ## Example with an object of class maigesNorm. plot(gastro.norm[,1]) ## Example for objects of class maigesDE. ## Doing bootstrap from t statistic test fot 'Type' sample label, k=1000 ## specifies one thousand bootstraps gastro.ttest = deGenes2by2Ttest(gastro.summ, sLabelID="Type") plot(gastro.ttest) ## Volcano plot ## Example for object of class maigesClass. ## Doing LDA classifier with 3 genes for the 6th gene group comparing ## the 2 categories from 'Type' sample label. gastro.class = classifyLDA(gastro.summ, sLabelID="Type", gNameID="GeneName", nGenes=3, geneGrp=6) plot(gastro.class) ## plot the 1st classifier plot(gastro.class, idx=7) ## plot the 7th classifier ## Example for object of class maigesActNet ## Doing functional classification of gene groups for 'Tissue' sample label gastro.mod = activeMod(gastro.summ, sLabelID="Tissue", cutExp=1, cutPhiper=0.05) plot(gastro.mod, "S", margins=c(15,3)) ## Plot for individual samples plot(gastro.mod, "C", margins=c(21,5)) ## Plot for unique biological conditions ## Example for object of class maigesRelNetB ## Constructing the relevance network (Butte's method) for sample ## 'Tissue' equal to 'Neso' for the 1st gene group gastro.net = relNetworkB(gastro.summ, sLabelID="Tissue", samples="Neso", geneGrp=1, type="Rpearson") plot(gastro.net, cutPval=0.05) ## Example for object of class maigesRelNetM ## Constructing the relevance network for sample ## 'Tissue' comparing 'Neso' and 'Aeso' for the 1st gene group gastro.net = relNetworkM(gastro.summ, sLabelID="Tissue", samples = list(Neso="Neso", Aeso="Aeso"), geneGrp=11, type="Rpearson") plot(gastro.net, cutPval=0.05) plot(gastro.net, cutPval=0.01) ## Example for objects of class maigesActNet ## Doing functional classification of gene networks for sample Label ## given by 'Tissue' gastro.net = activeNet(gastro.summ, sLabelID="Tissue") plot(gastro.net, type="score", margins=c(21,5)) plot(gastro.net, type="p-value", margins=c(21,5)) Results
R version 3.3.1 (2016-06-21) -- "Bug in Your Hair"
Copyright (C) 2016 The R Foundation for Statistical Computing
Platform: x86_64-pc-linux-gnu (64-bit)
R is free software and comes with ABSOLUTELY NO WARRANTY.
You are welcome to redistribute it under certain conditions.
Type 'license()' or 'licence()' for distribution details.
R is a collaborative project with many contributors.
Type 'contributors()' for more information and
'citation()' on how to cite R or R packages in publications.
Type 'demo()' for some demos, 'help()' for on-line help, or
'help.start()' for an HTML browser interface to help.
Type 'q()' to quit R.
> library(maigesPack)
Loading required package: convert
Loading required package: Biobase
Loading required package: BiocGenerics
Loading required package: parallel
Attaching package: 'BiocGenerics'
The following objects are masked from 'package:parallel':
clusterApply, clusterApplyLB, clusterCall, clusterEvalQ,
clusterExport, clusterMap, parApply, parCapply, parLapply,
parLapplyLB, parRapply, parSapply, parSapplyLB
The following objects are masked from 'package:stats':
IQR, mad, xtabs
The following objects are masked from 'package:base':
Filter, Find, Map, Position, Reduce, anyDuplicated, append,
as.data.frame, cbind, colnames, do.call, duplicated, eval, evalq,
get, grep, grepl, intersect, is.unsorted, lapply, lengths, mapply,
match, mget, order, paste, pmax, pmax.int, pmin, pmin.int, rank,
rbind, rownames, sapply, setdiff, sort, table, tapply, union,
unique, unsplit
Welcome to Bioconductor
Vignettes contain introductory material; view with
'browseVignettes()'. To cite Bioconductor, see
'citation("Biobase")', and for packages 'citation("pkgname")'.
Loading required package: limma
Attaching package: 'limma'
The following object is masked from 'package:BiocGenerics':
plotMA
Loading required package: marray
Loading required package: graph
> png(filename="/home/ddbj/snapshot/RGM3/R_BC/result/maigesPack/plot-methods.Rd_%03d_medium.png", width=480, height=480)
> ### Name: plot
> ### Title: Method plot for objects defined in this package
> ### Aliases: plot.maigesRaw plot.maiges plot.maigesANOVA plot.maigesDE
> ### plot.maigesDEcluster plot.maigesClass plot.maigesRelNetB
> ### plot.maigesRelNetM plot.maigesActMod plot.maigesActNet plot
> ### Keywords: array
>
> ### ** Examples
>
> ## Loading the dataset
> data(gastro)
>
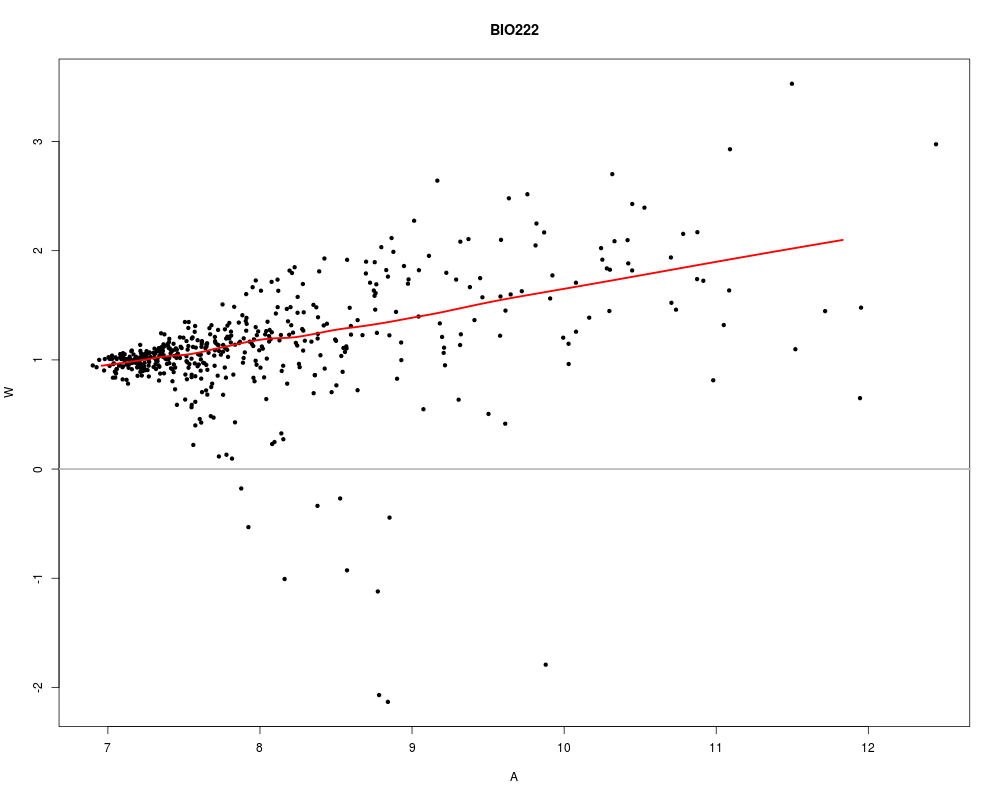
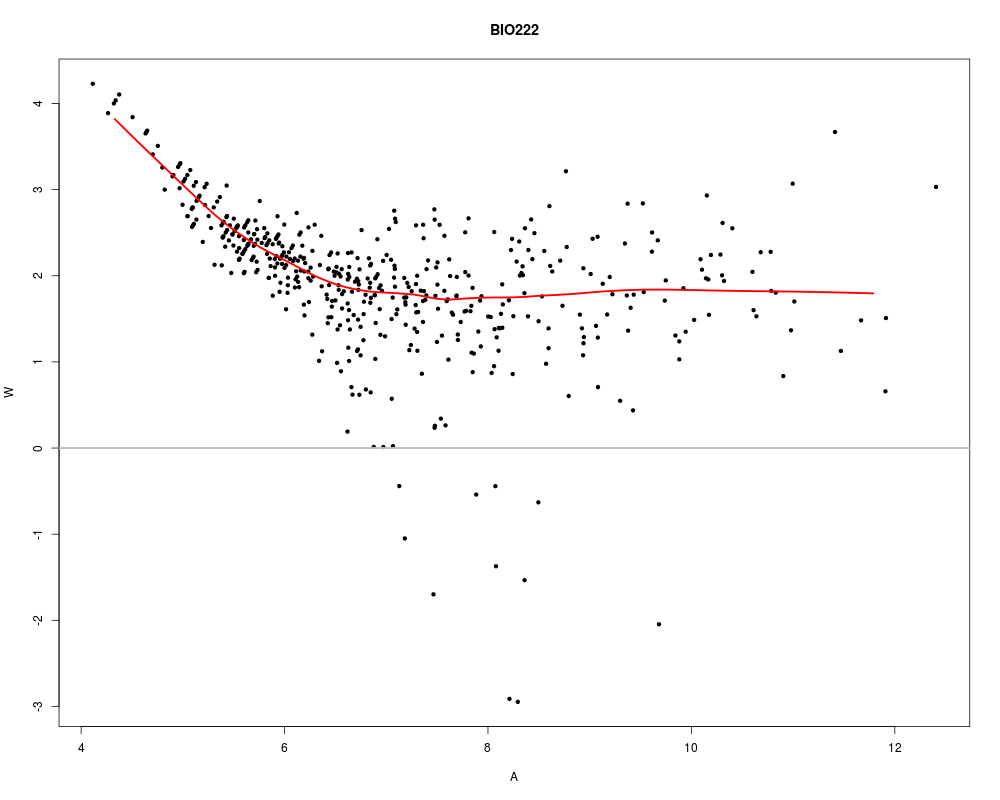
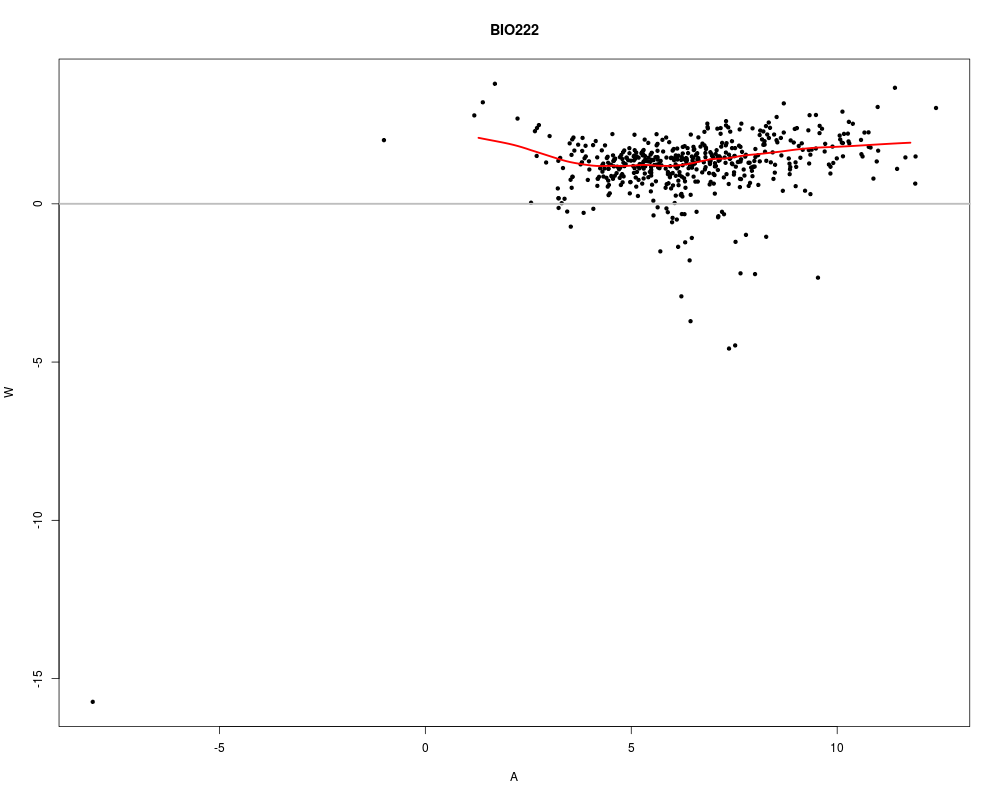
> ## Example with an object of class maigesRaw, without and with backgound
> ## subtraction, also we present a plot with normexp (from limma package)
> ## subtract algorithm.
> plot(gastro.raw[,1], bkgSub="none")
> plot(gastro.raw[,1], bkgSub="subtract")
> plot(gastro.raw[,1], bkgSub="normexp")
Array 1 corrected
Array 1 corrected
>
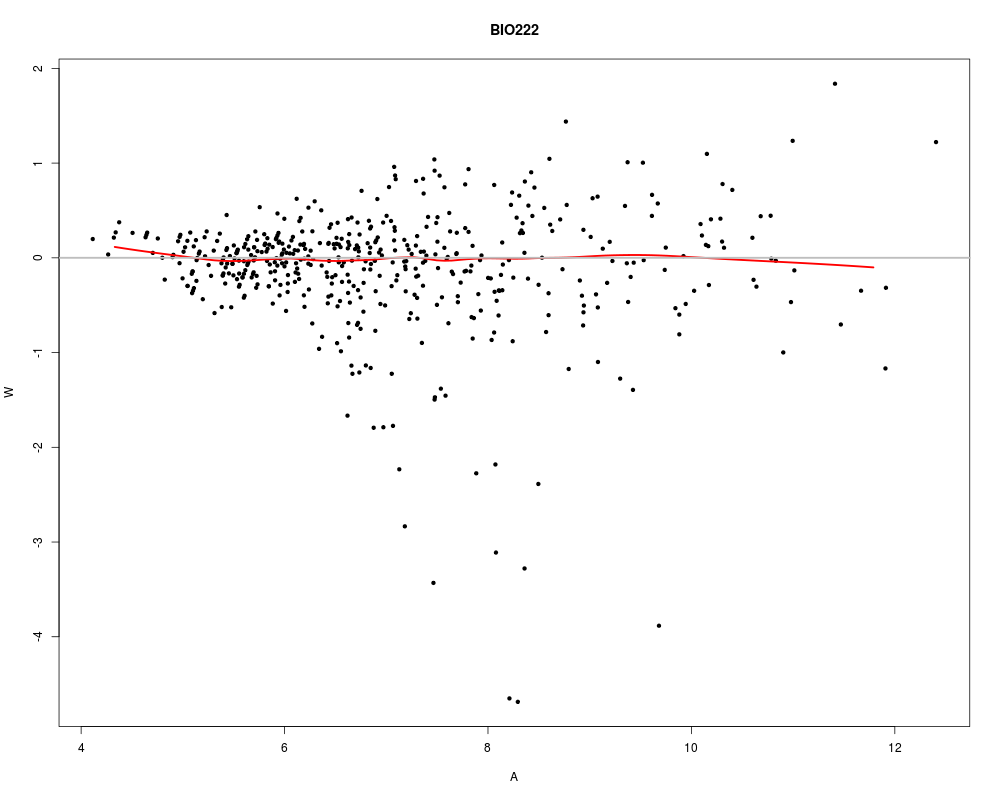
> ## Example with an object of class maigesNorm.
> plot(gastro.norm[,1])
>
>
>
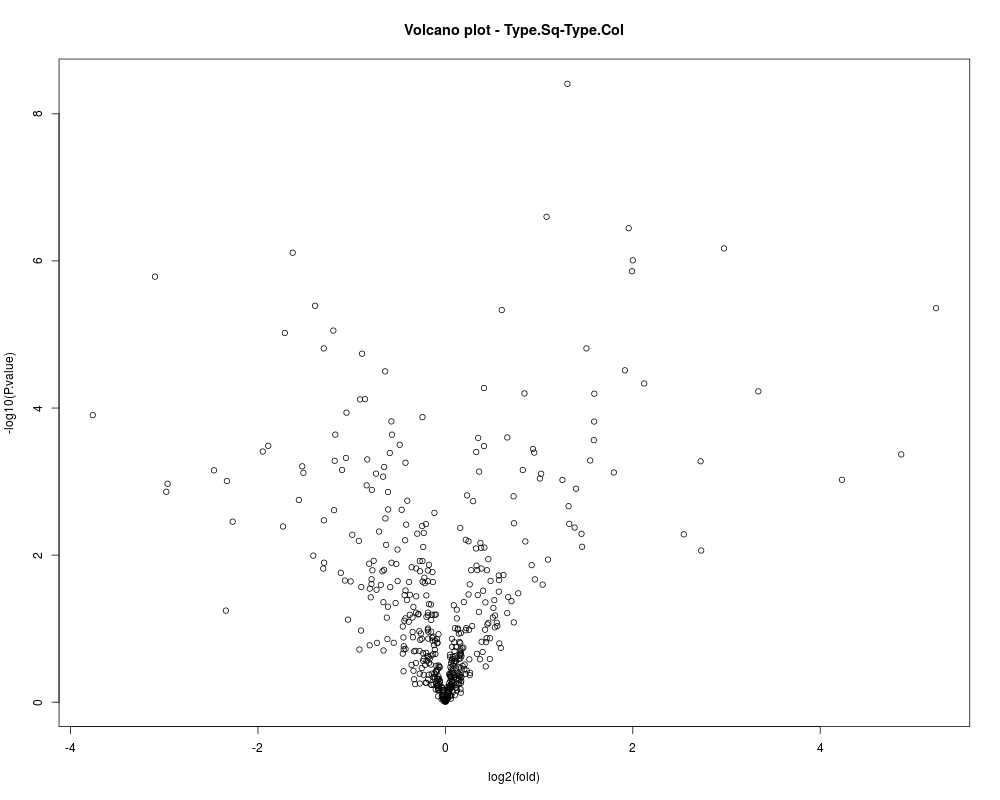
> ## Example for objects of class maigesDE.
>
> ## Doing bootstrap from t statistic test fot 'Type' sample label, k=1000
> ## specifies one thousand bootstraps
> gastro.ttest = deGenes2by2Ttest(gastro.summ, sLabelID="Type")
>
> plot(gastro.ttest) ## Volcano plot
>
>
> ## Example for object of class maigesClass.
>
> ## Doing LDA classifier with 3 genes for the 6th gene group comparing
> ## the 2 categories from 'Type' sample label.
> gastro.class = classifyLDA(gastro.summ, sLabelID="Type",
+ gNameID="GeneName", nGenes=3, geneGrp=6)
>
> plot(gastro.class) ## plot the 1st classifier
Loading required package: rgl
> plot(gastro.class, idx=7) ## plot the 7th classifier
>
>
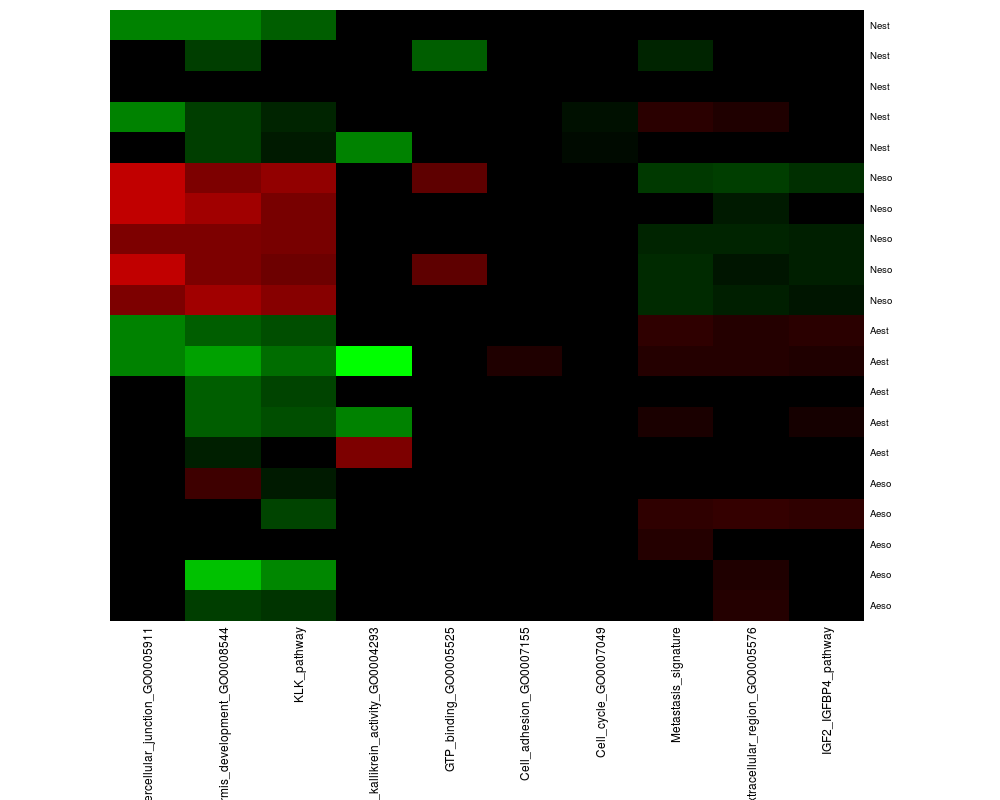
> ## Example for object of class maigesActNet
>
> ## Doing functional classification of gene groups for 'Tissue' sample label
> gastro.mod = activeMod(gastro.summ, sLabelID="Tissue", cutExp=1,
+ cutPhiper=0.05)
>
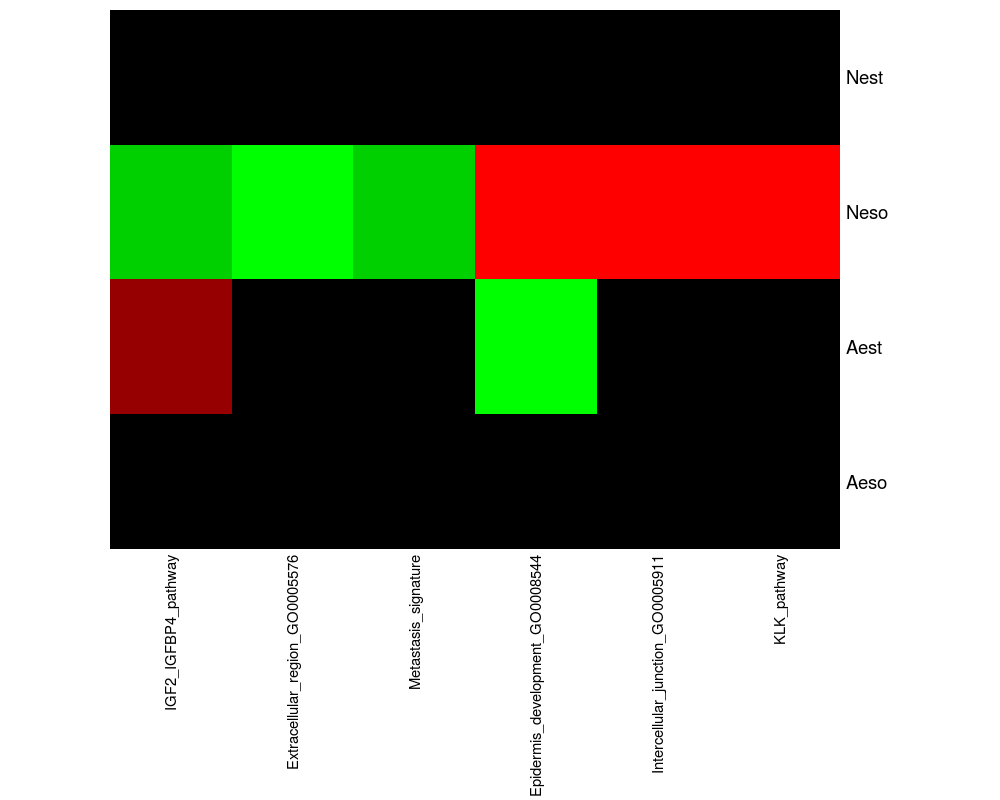
> plot(gastro.mod, "S", margins=c(15,3)) ## Plot for individual samples
> plot(gastro.mod, "C", margins=c(21,5)) ## Plot for unique biological conditions
>
>
>
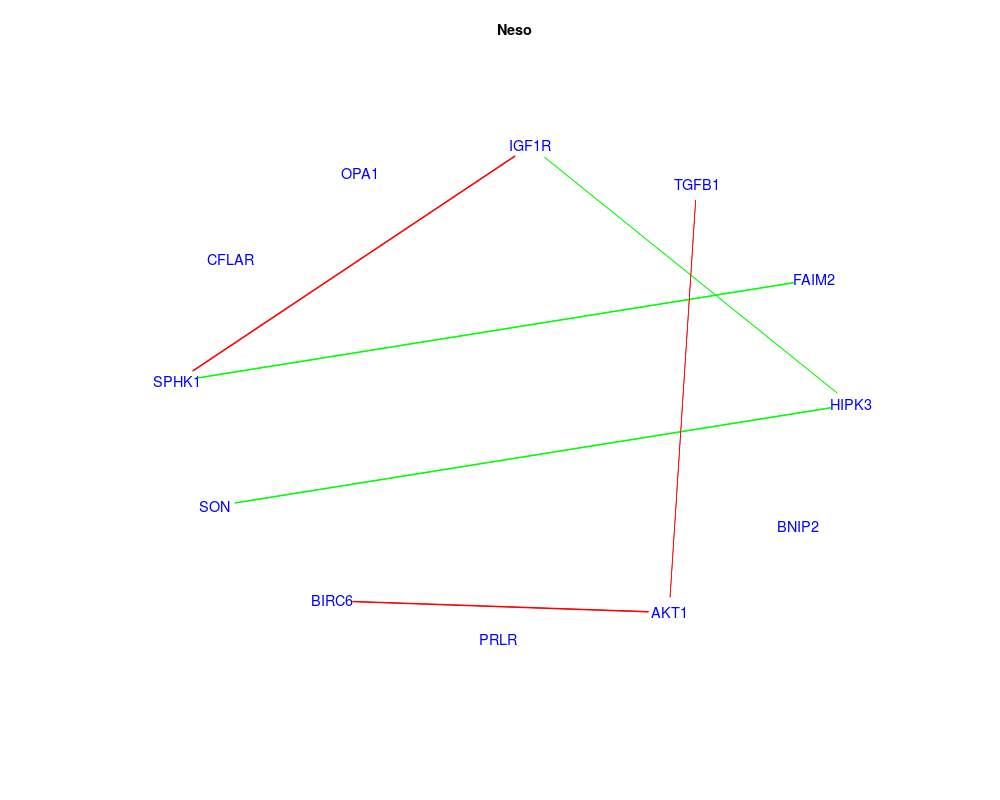
> ## Example for object of class maigesRelNetB
>
> ## Constructing the relevance network (Butte's method) for sample
> ## 'Tissue' equal to 'Neso' for the 1st gene group
> gastro.net = relNetworkB(gastro.summ, sLabelID="Tissue",
+ samples="Neso", geneGrp=1, type="Rpearson")
>
> plot(gastro.net, cutPval=0.05)
>
>
>
>
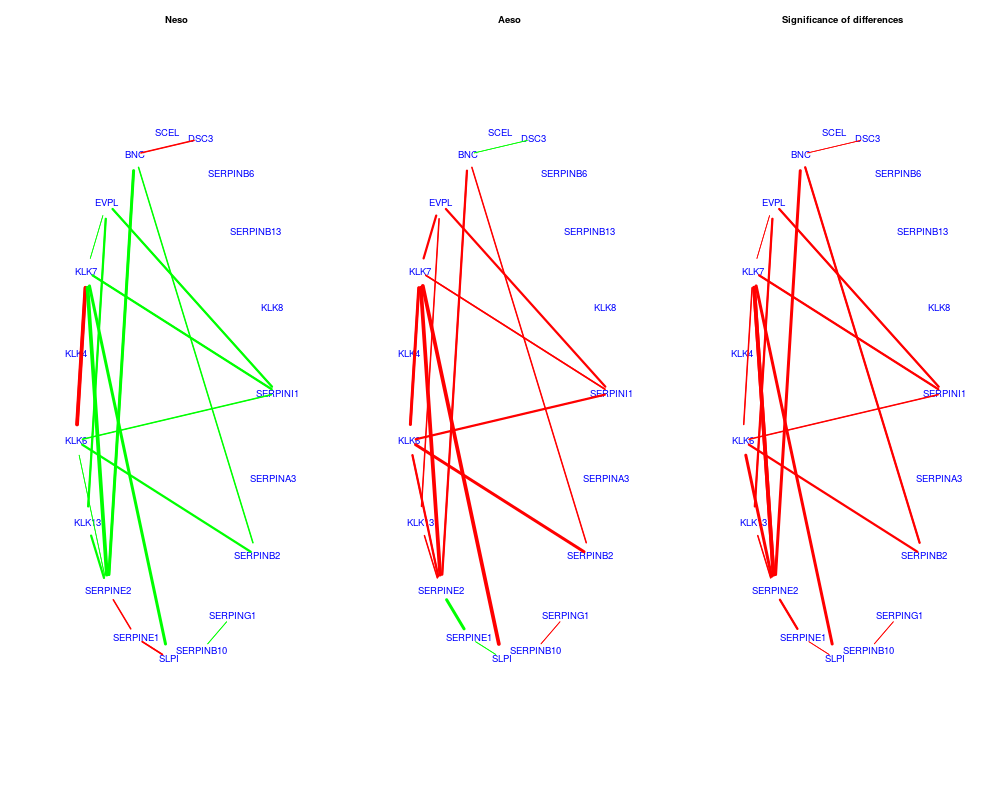
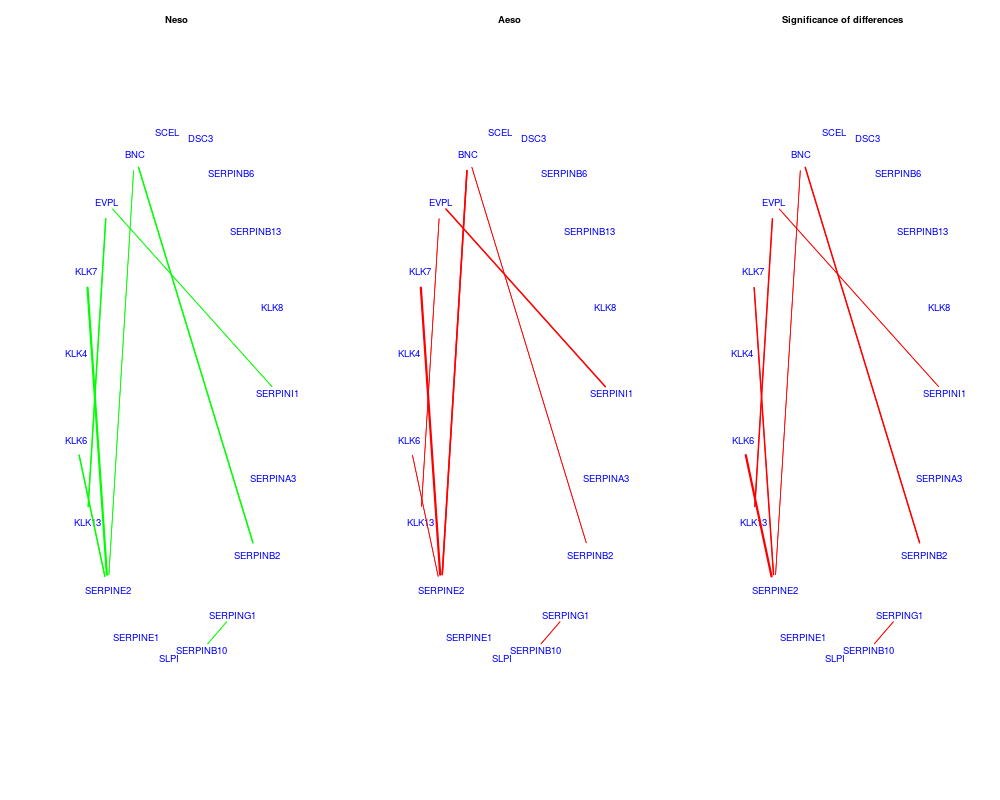
> ## Example for object of class maigesRelNetM
>
> ## Constructing the relevance network for sample
> ## 'Tissue' comparing 'Neso' and 'Aeso' for the 1st gene group
> gastro.net = relNetworkM(gastro.summ, sLabelID="Tissue",
+ samples = list(Neso="Neso", Aeso="Aeso"), geneGrp=11,
+ type="Rpearson")
>
> plot(gastro.net, cutPval=0.05)
> plot(gastro.net, cutPval=0.01)
>
>
>
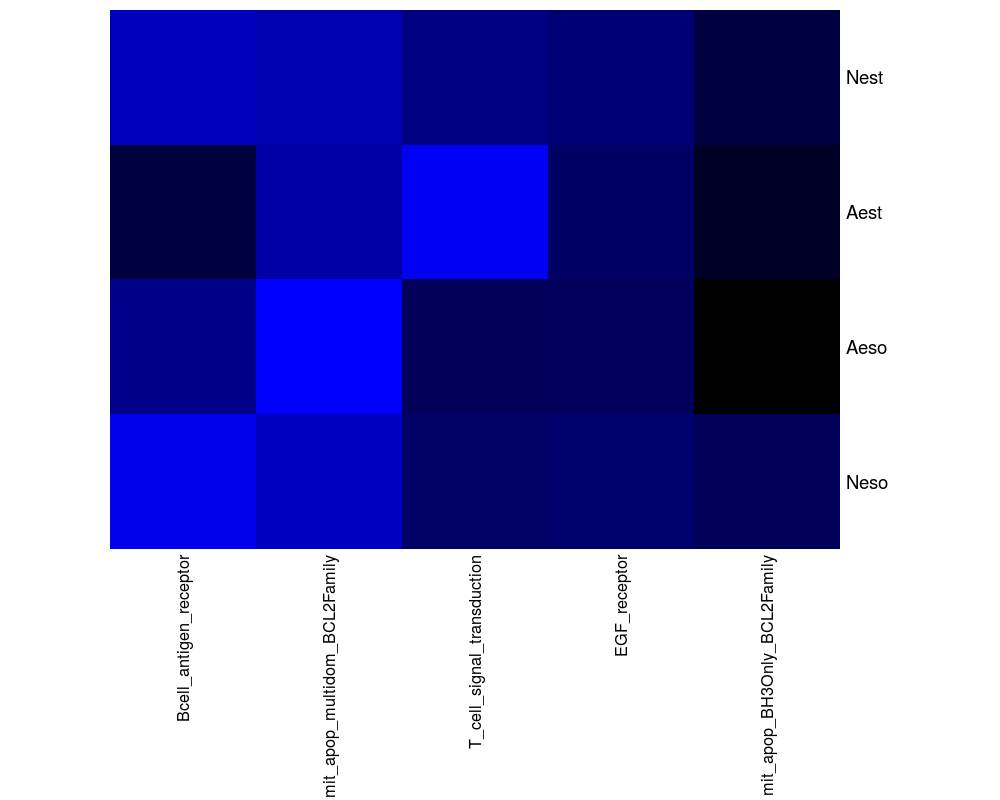
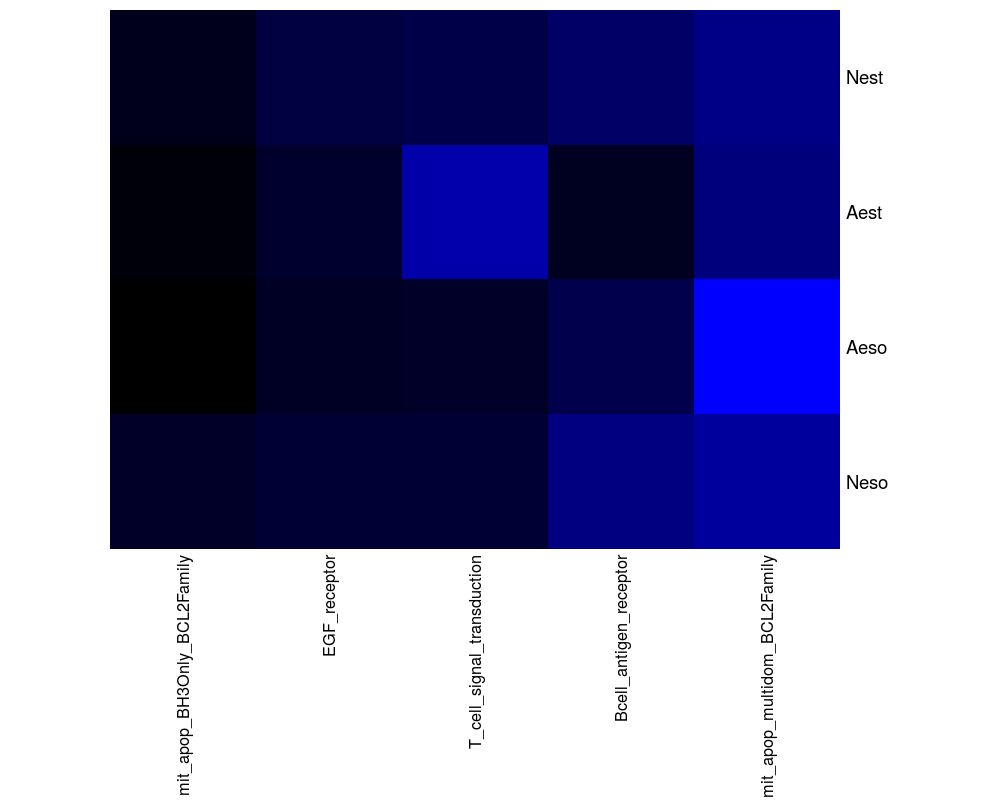
> ## Example for objects of class maigesActNet
>
> ## Doing functional classification of gene networks for sample Label
> ## given by 'Tissue'
> gastro.net = activeNet(gastro.summ, sLabelID="Tissue")
>
> plot(gastro.net, type="score", margins=c(21,5))
> plot(gastro.net, type="p-value", margins=c(21,5))
>
>
>
>
>
> dev.off()
null device
1
>
|