Supported by Dr. Osamu Ogasawara and  . . |
|
Last data update: 2014.03.03 |
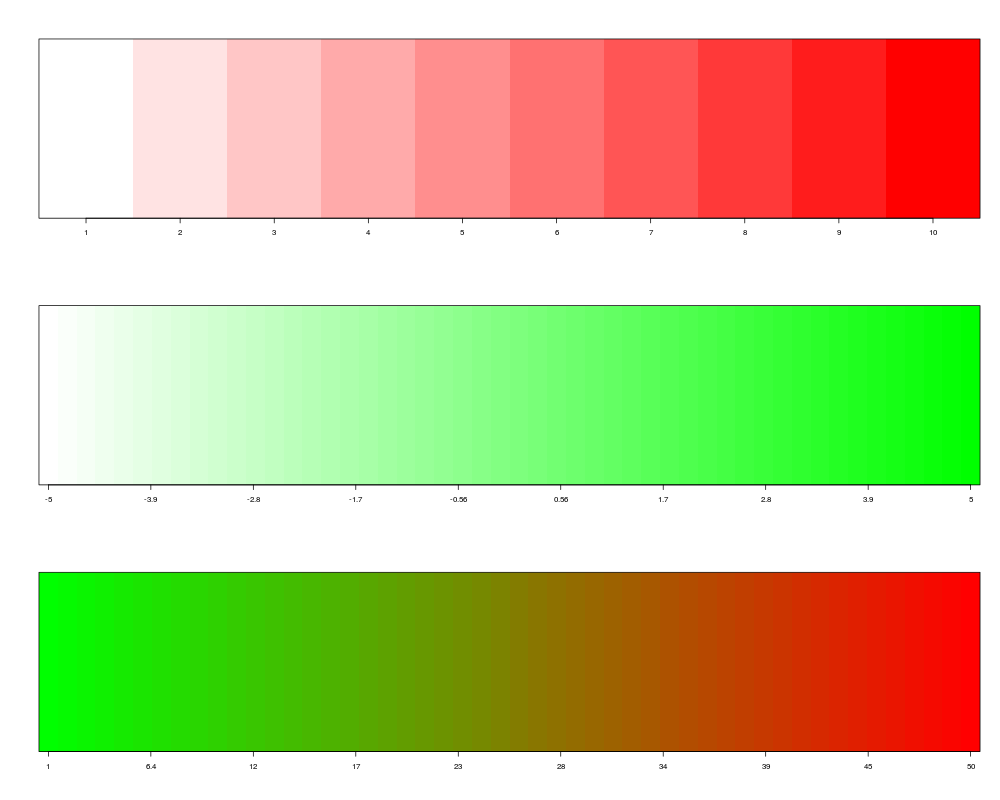
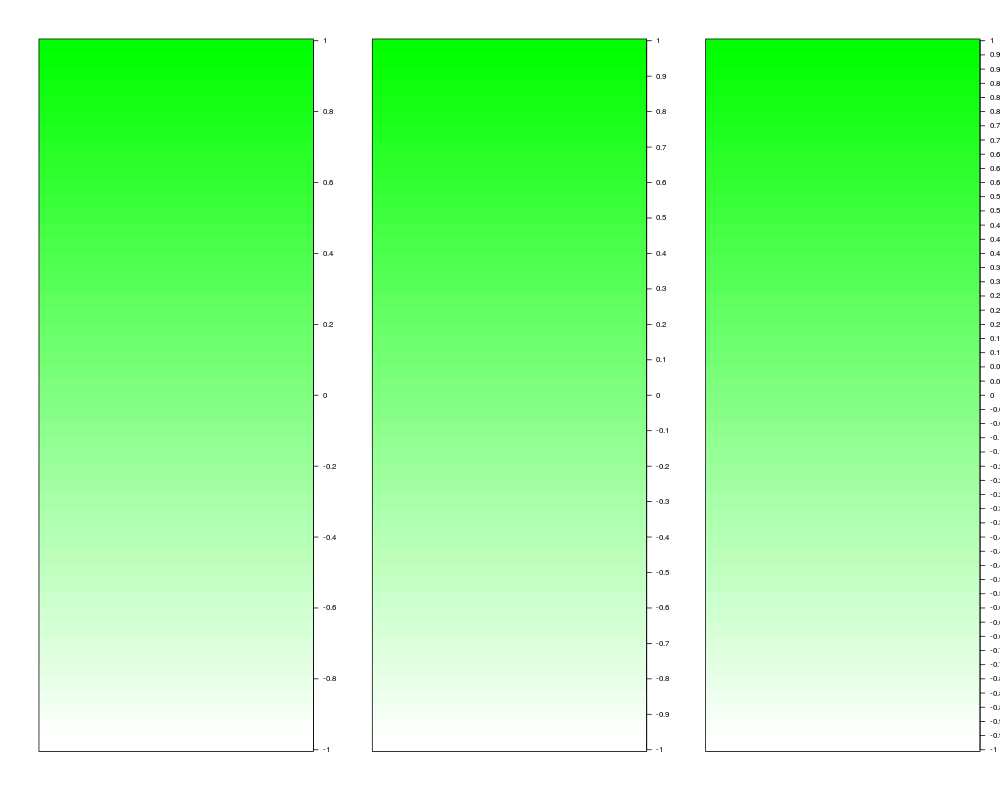
Calibration bar for color imagesDescriptionThis function produces a color image (color bar) which can be used for
the legend to another color image obtained from the functions
UsagemaColorBar(x, horizontal=TRUE, col=heat.colors(50), scale=1:length(x), k=10, ...) Arguments
Author(s)Sandrine Dudoit, http://www.stat.berkeley.edu/~sandrine, Yee Hwa (Jean) Yang. ReferencesS. Dudoit and Y. H. Yang. (2002). Bioconductor R packages for exploratory analysis and normalization of cDNA microarray data. In G. Parmigiani, E. S. Garrett, R. A. Irizarry and S. L. Zeger, editors, The Analysis of Gene Expression Data: Methods and Software, Springer, New York. See Also
Examplespar(mfrow=c(3,1)) Rcol <- maPalette(low="white", high="red", k=10) Gcol <- maPalette(low="white", high="green", k=50) RGcol <- maPalette(low="green", high="red", k=100) maColorBar(Rcol) maColorBar(Gcol, scale=c(-5,5)) maColorBar(1:50, col=RGcol) par(mfrow=c(1,3)) x<-seq(-1, 1, by=0.01) maColorBar(x, col=Gcol, horizontal=FALSE, k=11) maColorBar(x, col=Gcol, horizontal=FALSE, k=21) maColorBar(x, col=Gcol, horizontal=FALSE, k=51) Results
R version 3.3.1 (2016-06-21) -- "Bug in Your Hair"
Copyright (C) 2016 The R Foundation for Statistical Computing
Platform: x86_64-pc-linux-gnu (64-bit)

R is free software and comes with ABSOLUTELY NO WARRANTY.
You are welcome to redistribute it under certain conditions.
Type 'license()' or 'licence()' for distribution details.

R is a collaborative project with many contributors.
Type 'contributors()' for more information and
'citation()' on how to cite R or R packages in publications.

Type 'demo()' for some demos, 'help()' for on-line help, or
'help.start()' for an HTML browser interface to help.
Type 'q()' to quit R.

> library(marray)
Loading required package: limma
> png(filename="/home/ddbj/snapshot/RGM3/R_BC/result/marray/maColorBar.Rd_%03d_medium.png", width=480, height=480)
> ### Name: maColorBar
> ### Title: Calibration bar for color images
> ### Aliases: maColorBar
> ### Keywords: aplot hplot
>
> ### ** Examples
>
> par(mfrow=c(3,1))
> Rcol <- maPalette(low="white", high="red", k=10)
> Gcol <- maPalette(low="white", high="green", k=50)
> RGcol <- maPalette(low="green", high="red", k=100)
> maColorBar(Rcol)
> maColorBar(Gcol, scale=c(-5,5))
> maColorBar(1:50, col=RGcol)
>
> par(mfrow=c(1,3))
> x<-seq(-1, 1, by=0.01)
> maColorBar(x, col=Gcol, horizontal=FALSE, k=11)
> maColorBar(x, col=Gcol, horizontal=FALSE, k=21)
> maColorBar(x, col=Gcol, horizontal=FALSE, k=51)
>
>
>
>
>
> dev.off()
null device
          1
>
|