R: Replace graphical default parameters by user supplied...
maDotsDefaults
R Documentation
Replace graphical default parameters by user supplied parameters
Description
This function may be used to compare default graphical parameters for microarray diagnostic plots to user supplied parameters given in .... User supplied parameters overwrite the defaults. It is used in maBoxplot, maPlot, and maImage.
Usage
maDotsDefaults(dots, defaults)
Arguments
dots
List of user supplied parameters, e.g. from list(...).
defaults
List of default parameters, e.g. from the function maDefaultPar.
S. Dudoit and Y. H. Yang. (2002). Bioconductor R packages for exploratory analysis and normalization of cDNA microarray data. In G. Parmigiani, E. S. Garrett, R. A. Irizarry and S. L. Zeger, editors, The Analysis of Gene Expression Data: Methods and Software, Springer, New York.
R version 3.3.1 (2016-06-21) -- "Bug in Your Hair"
Copyright (C) 2016 The R Foundation for Statistical Computing
Platform: x86_64-pc-linux-gnu (64-bit)
R is free software and comes with ABSOLUTELY NO WARRANTY.
You are welcome to redistribute it under certain conditions.
Type 'license()' or 'licence()' for distribution details.
R is a collaborative project with many contributors.
Type 'contributors()' for more information and
'citation()' on how to cite R or R packages in publications.
Type 'demo()' for some demos, 'help()' for on-line help, or
'help.start()' for an HTML browser interface to help.
Type 'q()' to quit R.
> library(marray)
Loading required package: limma
> png(filename="/home/ddbj/snapshot/RGM3/R_BC/result/marray/maDotsDefaults.Rd_%03d_medium.png", width=480, height=480)
> ### Name: maDotsDefaults
> ### Title: Replace graphical default parameters by user supplied parameters
> ### Aliases: maDotsDefaults
> ### Keywords: misc
>
> ### ** Examples
>
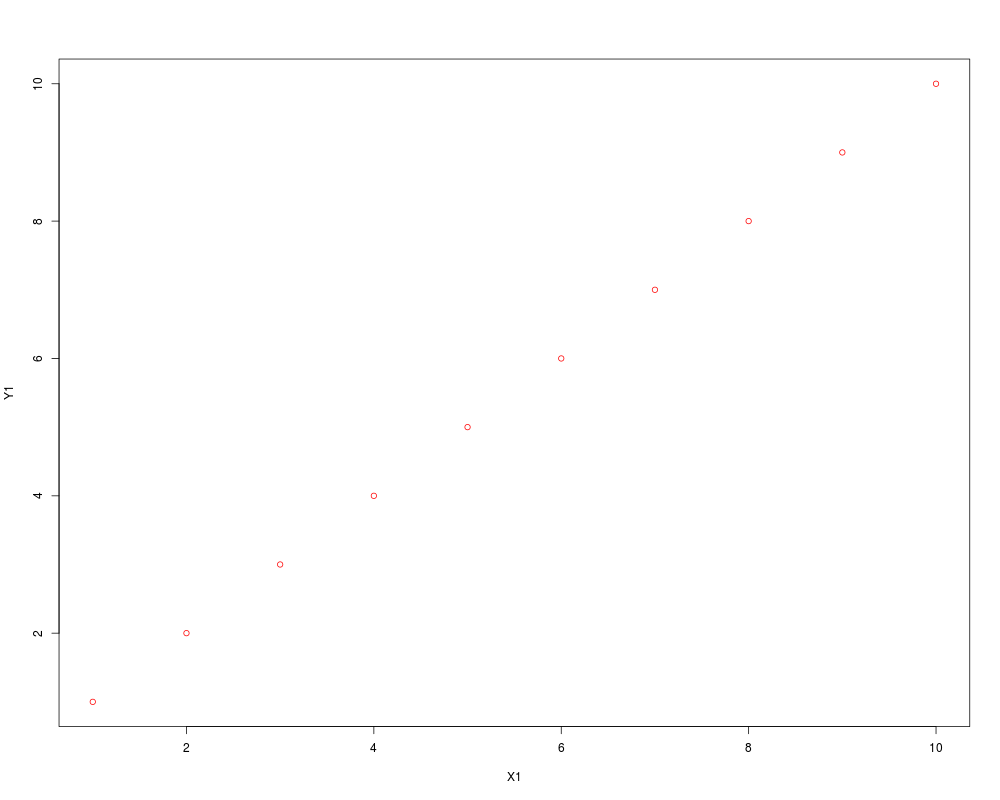
> dots<-list(xlab="X1", ylab="Y1")
> defaults<-list(xlab="X1", ylab="Y2", col=2)
> pars<-maDotsDefaults(dots, defaults)
>
> do.call("plot",c(list(x=1:10), pars))
>
>
>
>
>
>
> dev.off()
null device
1
>
 .
.