Supported by Dr. Osamu Ogasawara and  . . |
|
Last data update: 2014.03.03 |
Color image for cDNA microarray spot statisticsDescriptionWe encourage users calling "image" rather than "maImage". The name of the arguments are change slightly. The function UsagemaImage(m, x="maM", subset=TRUE, col, contours=FALSE, bar=TRUE, overlay=NULL, ol.col=1, colorinfo=FALSE, ...) Arguments
DetailsThis function calls the general function ValueIf
Author(s)Sandrine Dudoit, http://www.stat.berkeley.edu/~sandrine. ReferencesS. Dudoit and Y. H. Yang. (2002). Bioconductor R packages for exploratory analysis and normalization of cDNA microarray data. In G. Parmigiani, E. S. Garrett, R. A. Irizarry and S. L. Zeger, editors, The Analysis of Gene Expression Data: Methods and Software, Springer, New York. See Also
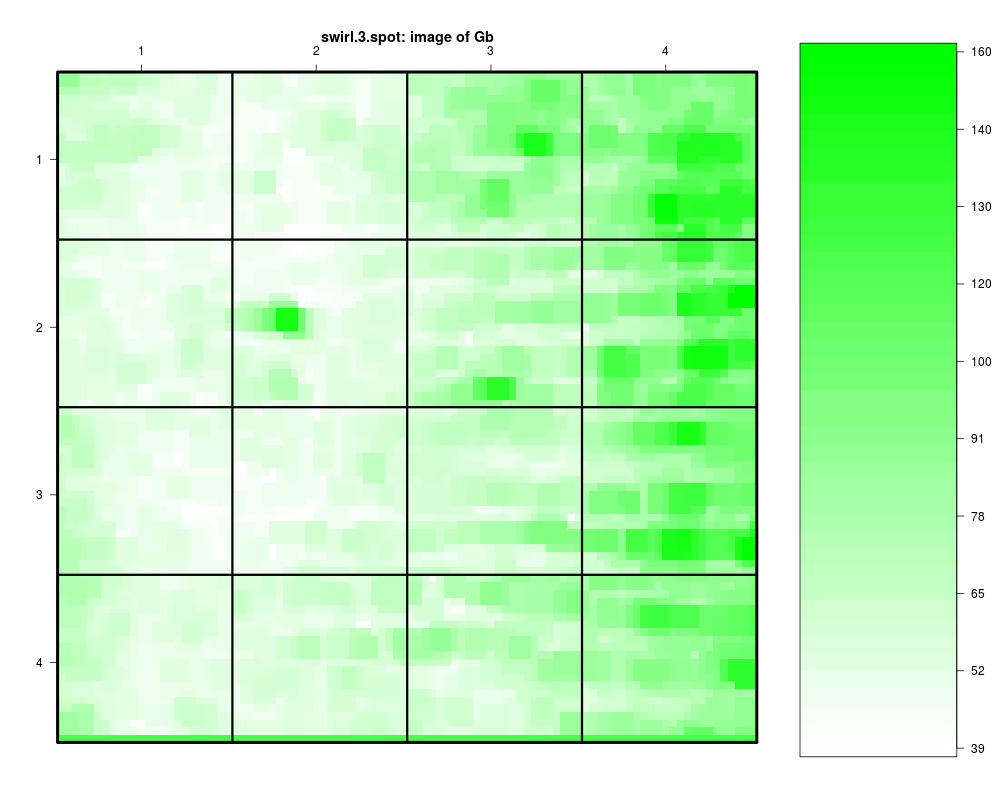
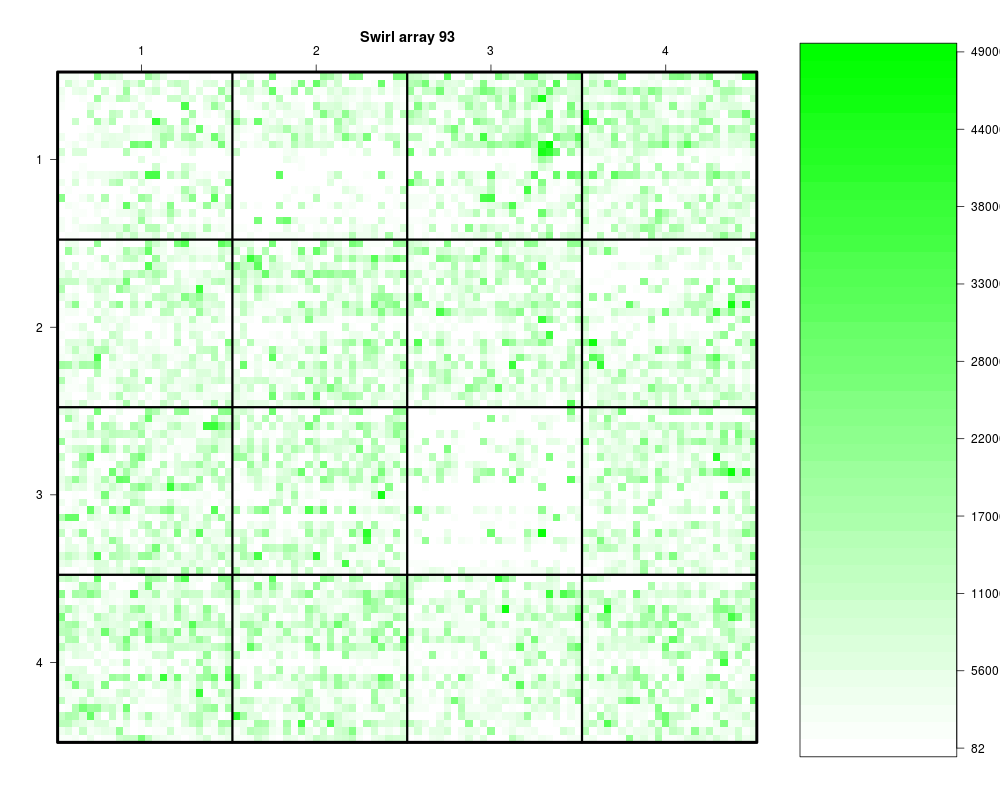
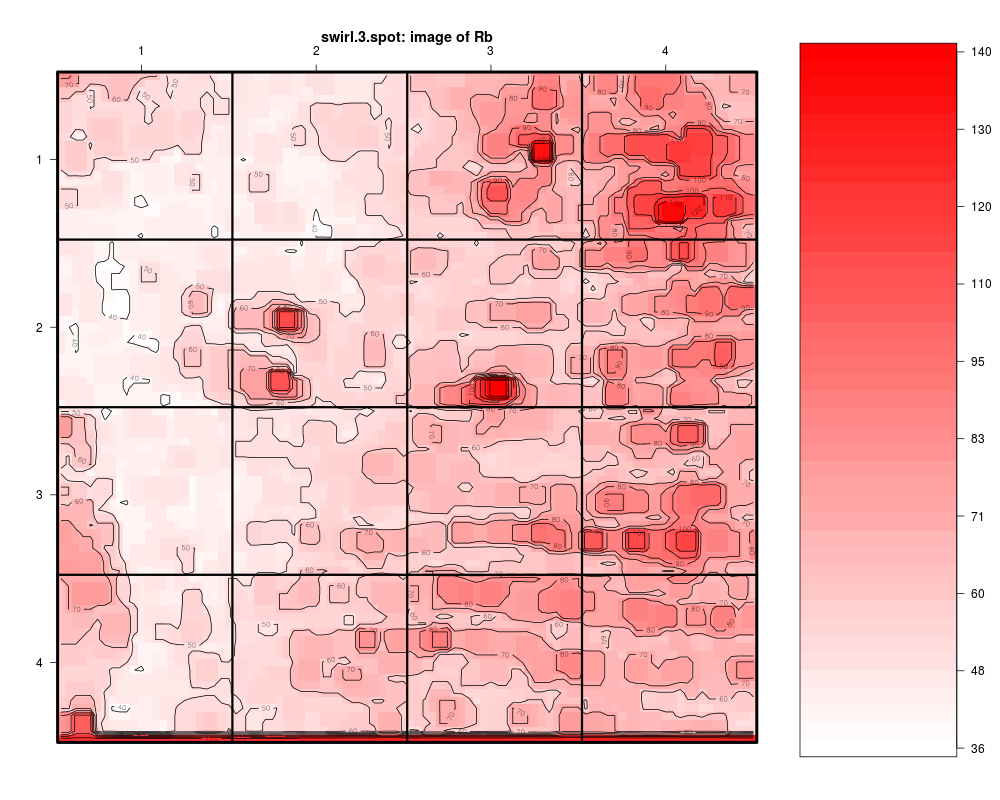
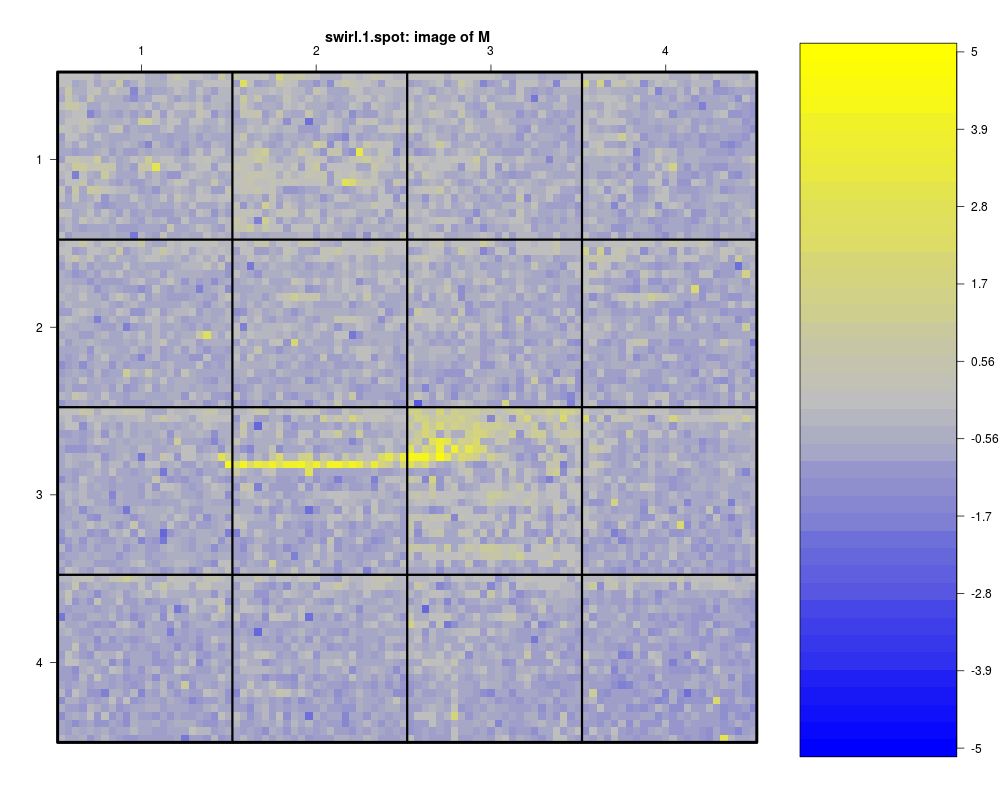
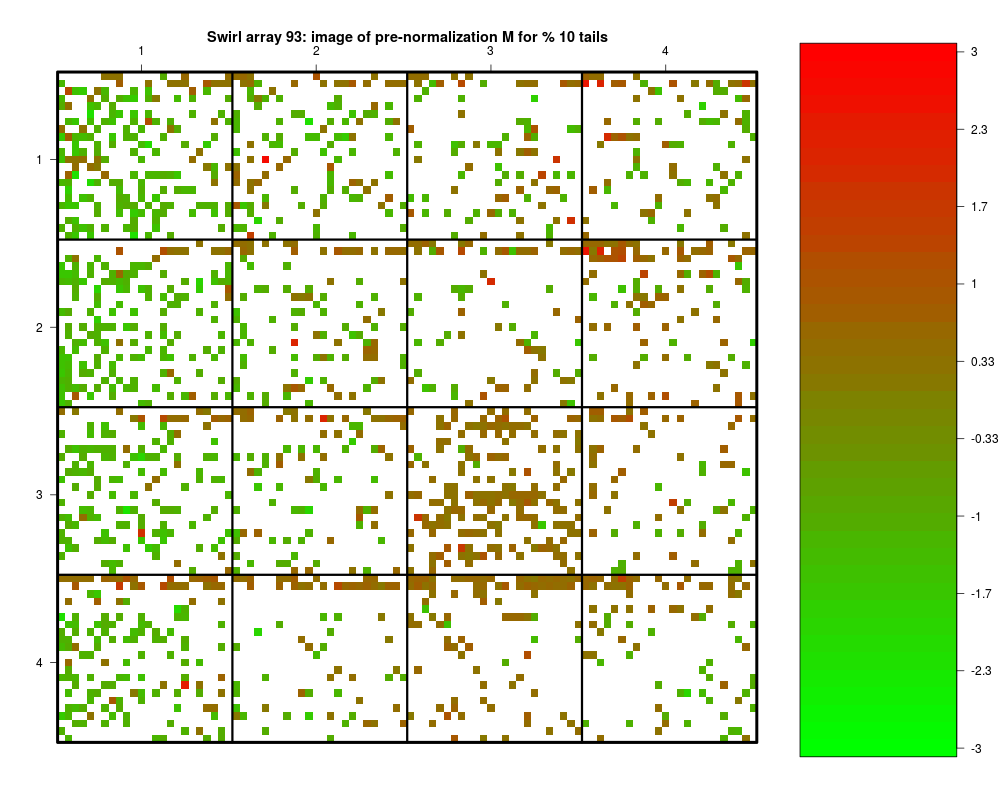
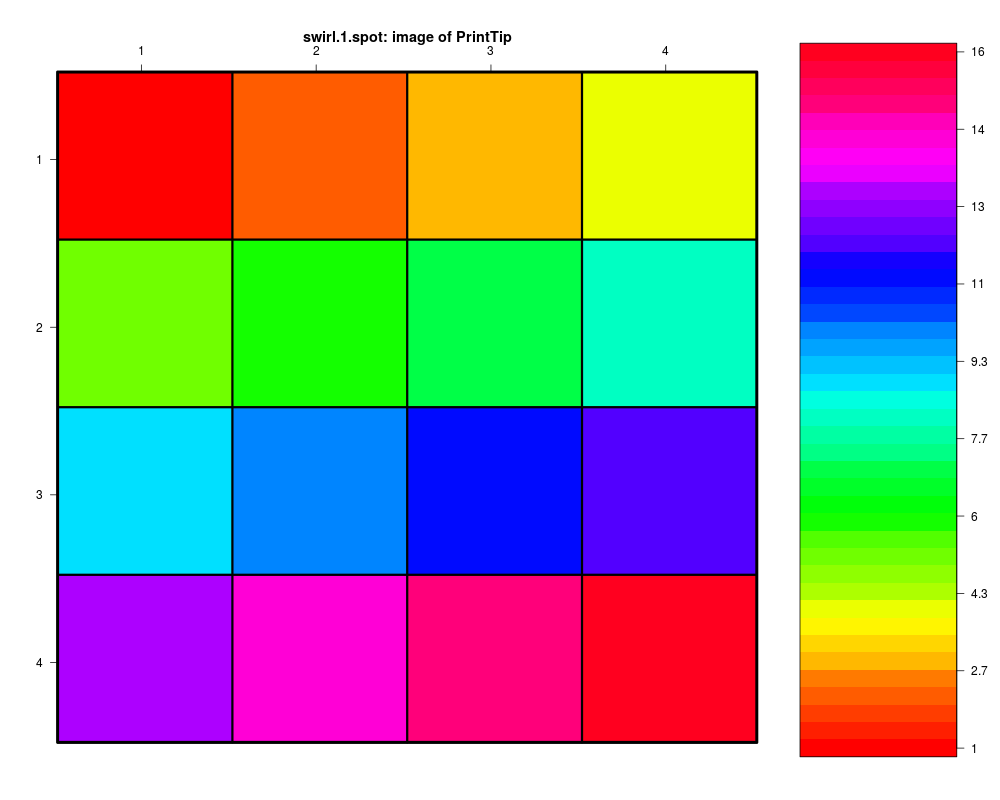
Examples# To see the demo type demo(marrayPlots) # Examples use swirl dataset, for description type ? swirl data(swirl) # Microarray color palettes Gcol <- maPalette(low = "white", high = "green", k = 50) Rcol <- maPalette(low = "white", high = "red", k = 50) RGcol <- maPalette(low = "green", high = "red", k = 50) # Color images of green and red background and foreground intensities maImage(swirl[, 3], x="maGb") maImage(swirl[, 3], x = "maGf", subset = TRUE, col = Gcol, contours = FALSE, bar = TRUE, main="Swirl array 93") maImage(swirl[, 3], x = "maRb", contour=TRUE) maImage(swirl[, 3], x = "maRf", bar=FALSE) # Color images of pre-normalization intensity log-ratios maImage(swirl[, 1]) maImage(swirl[, 3], x = "maM", subset = maTop(maM(swirl[, 3]), h = 0.1, l = 0.1), col = RGcol, contours = FALSE, bar = TRUE, main = "Swirl array 93: image of pre-normalization M for % 10 tails") # Color image of print-tip-group maImage(swirl[, 1],x="maPrintTip") Results
R version 3.3.1 (2016-06-21) -- "Bug in Your Hair"
Copyright (C) 2016 The R Foundation for Statistical Computing
Platform: x86_64-pc-linux-gnu (64-bit)

R is free software and comes with ABSOLUTELY NO WARRANTY.
You are welcome to redistribute it under certain conditions.
Type 'license()' or 'licence()' for distribution details.

R is a collaborative project with many contributors.
Type 'contributors()' for more information and
'citation()' on how to cite R or R packages in publications.

Type 'demo()' for some demos, 'help()' for on-line help, or
'help.start()' for an HTML browser interface to help.
Type 'q()' to quit R.

> library(marray)
Loading required package: limma
> png(filename="/home/ddbj/snapshot/RGM3/R_BC/result/marray/maImage.Rd_%03d_medium.png", width=480, height=480)
> ### Name: maImage
> ### Title: Color image for cDNA microarray spot statistics
> ### Aliases: maImage
> ### Keywords: hplot
>
> ### ** Examples
>
>
> # To see the demo type demo(marrayPlots)
>
> # Examples use swirl dataset, for description type ? swirl
> data(swirl)
>
> # Microarray color palettes
> Gcol <- maPalette(low = "white", high = "green", k = 50)
> Rcol <- maPalette(low = "white", high = "red", k = 50)
> RGcol <- maPalette(low = "green", high = "red", k = 50)
>
> # Color images of green and red background and foreground intensities
> maImage(swirl[, 3], x="maGb")
[1] FALSE
NULL
> maImage(swirl[, 3], x = "maGf", subset = TRUE, col = Gcol, contours = FALSE, bar = TRUE, main="Swirl array 93")
[1] FALSE
NULL
> maImage(swirl[, 3], x = "maRb", contour=TRUE)
[1] FALSE
NULL
> maImage(swirl[, 3], x = "maRf", bar=FALSE)
[1] FALSE
NULL
>
> # Color images of pre-normalization intensity log-ratios
> maImage(swirl[, 1])
[1] FALSE
NULL
> maImage(swirl[, 3], x = "maM", subset = maTop(maM(swirl[, 3]), h = 0.1, l = 0.1), col = RGcol, contours = FALSE, bar = TRUE, main = "Swirl array 93: image of pre-normalization M for % 10 tails")
[1] FALSE
NULL
>
> # Color image of print-tip-group
> maImage(swirl[, 1],x="maPrintTip")
[1] FALSE
NULL
>
>
>
>
>
>
> dev.off()
null device
          1
>
|