Supported by Dr. Osamu Ogasawara and  . . |
|
Last data update: 2014.03.03 |
Microarray color paletteDescriptionThis function returns a vector of color names corresponding to a range of colors specified in the arguments. Usage
maPalette(low = "white", high = c("green", "red"), mid=NULL, k =50)
Arguments
ValueA "character" vector of color names. This can be used to create a user-defined color palette for subsequent graphics by Author(s)Sandrine Dudoit, http://www.stat.berkeley.edu/~sandrine, Yee Hwa (Jean) Yang. ReferencesS. Dudoit and Y. H. Yang. (2002). Bioconductor R packages for exploratory analysis and normalization of cDNA microarray data. In G. Parmigiani, E. S. Garrett, R. A. Irizarry and S. L. Zeger, editors, The Analysis of Gene Expression Data: Methods and Software, Springer, New York. See Also
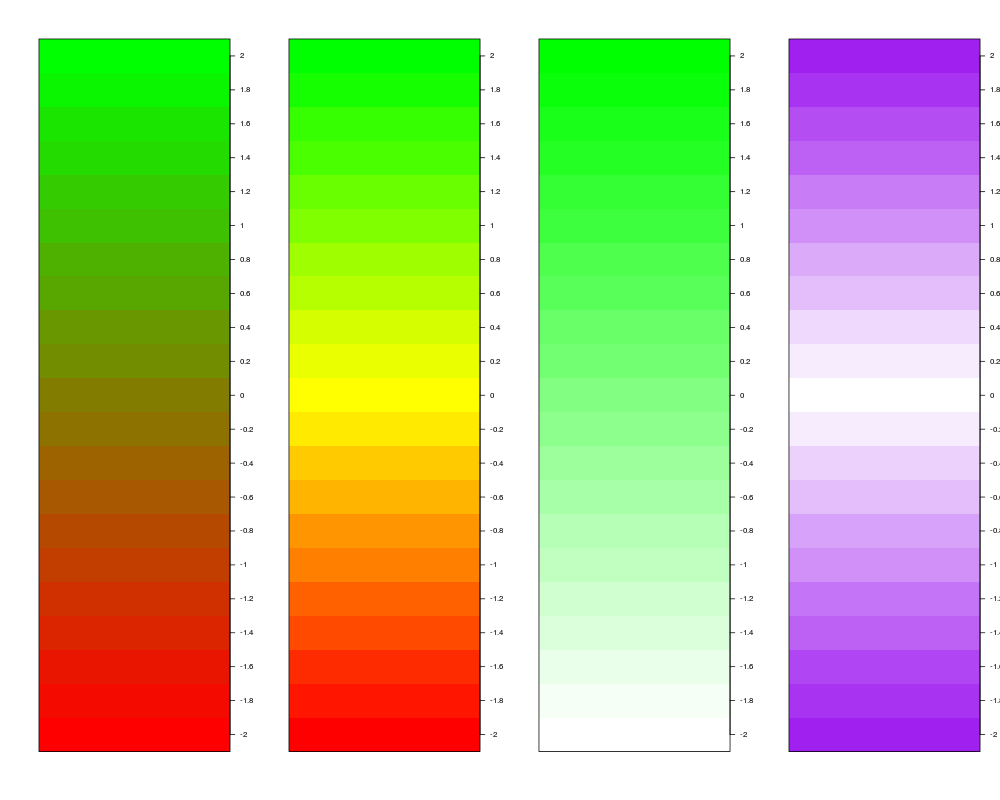
Examplespar(mfrow=c(1,4)) pal <- maPalette(low="red", high="green") maColorBar(seq(-2,2, 0.2), col=pal, horizontal=FALSE, k=21) pal <- maPalette(low="red", high="green", mid="yellow") maColorBar(seq(-2,2, 0.2), col=pal, horizontal=FALSE, k=21) pal <- maPalette() maColorBar(seq(-2,2, 0.2), col=pal, horizontal=FALSE, k=21) pal <- maPalette(low="purple", high="purple",mid="white") maColorBar(seq(-2,2, 0.2), col=pal, horizontal=FALSE, k=21) Results
R version 3.3.1 (2016-06-21) -- "Bug in Your Hair"
Copyright (C) 2016 The R Foundation for Statistical Computing
Platform: x86_64-pc-linux-gnu (64-bit)

R is free software and comes with ABSOLUTELY NO WARRANTY.
You are welcome to redistribute it under certain conditions.
Type 'license()' or 'licence()' for distribution details.

R is a collaborative project with many contributors.
Type 'contributors()' for more information and
'citation()' on how to cite R or R packages in publications.

Type 'demo()' for some demos, 'help()' for on-line help, or
'help.start()' for an HTML browser interface to help.
Type 'q()' to quit R.

> library(marray)
Loading required package: limma
> png(filename="/home/ddbj/snapshot/RGM3/R_BC/result/marray/maPalette.Rd_%03d_medium.png", width=480, height=480)
> ### Name: maPalette
> ### Title: Microarray color palette
> ### Aliases: maPalette
> ### Keywords: color
>
> ### ** Examples
>
> par(mfrow=c(1,4))
> pal <- maPalette(low="red", high="green")
> maColorBar(seq(-2,2, 0.2), col=pal, horizontal=FALSE, k=21)
> pal <- maPalette(low="red", high="green", mid="yellow")
> maColorBar(seq(-2,2, 0.2), col=pal, horizontal=FALSE, k=21)
> pal <- maPalette()
> maColorBar(seq(-2,2, 0.2), col=pal, horizontal=FALSE, k=21)
> pal <- maPalette(low="purple", high="purple",mid="white")
> maColorBar(seq(-2,2, 0.2), col=pal, horizontal=FALSE, k=21)
>
>
>
>
>
> dev.off()
null device
          1
>
|