Supported by Dr. Osamu Ogasawara and  . . |
|
Last data update: 2014.03.03 |
Scatter-plots for cDNA microarray spot statisticsDescriptionThe function UsagemaPlot(m, x="maA", y="maM", z="maPrintTip", lines.func, text.func, legend.func, ...) Arguments
DetailsThis function calls the general function Author(s)Sandrine Dudoit, http://www.stat.berkeley.edu/~sandrine. ReferencesS. Dudoit and Y. H. Yang. (2002). Bioconductor R packages for exploratory analysis and normalization of cDNA microarray data. In G. Parmigiani, E. S. Garrett, R. A. Irizarry and S. L. Zeger, editors, The Analysis of Gene Expression Data: Methods and Software, Springer, New York. See Also
Examples
# To see the demo type demo(marrayPlots)
# Examples use swirl dataset, for description type ? swirl
data(swirl)
# - Default arguments
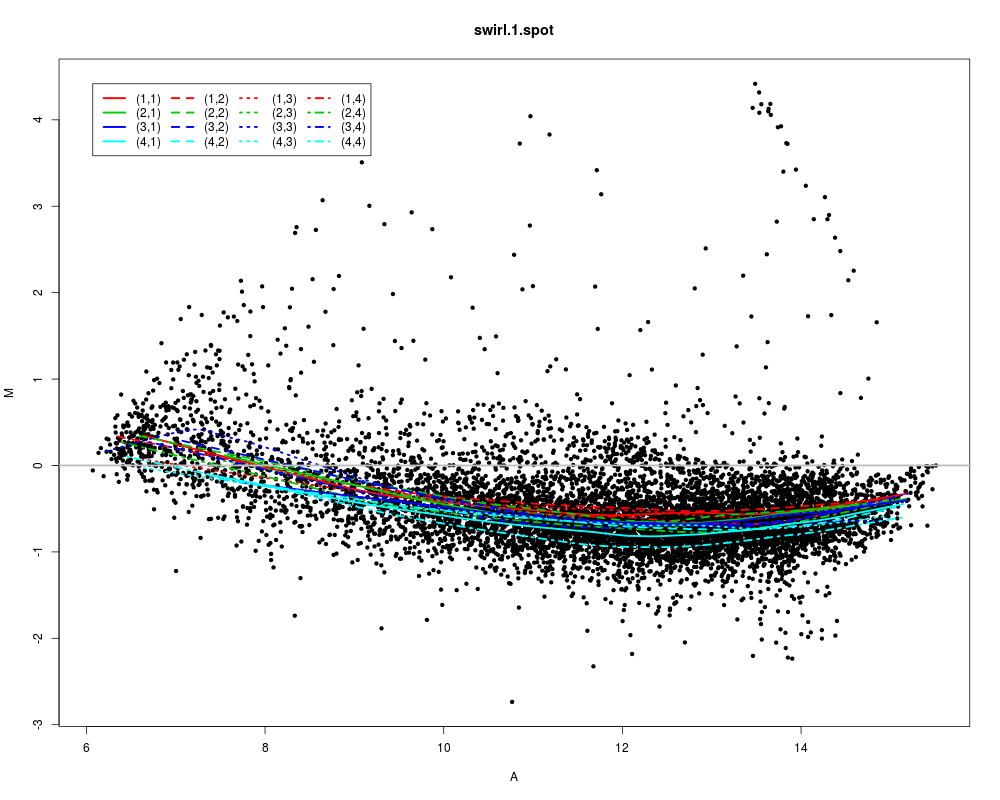
maPlot(swirl)
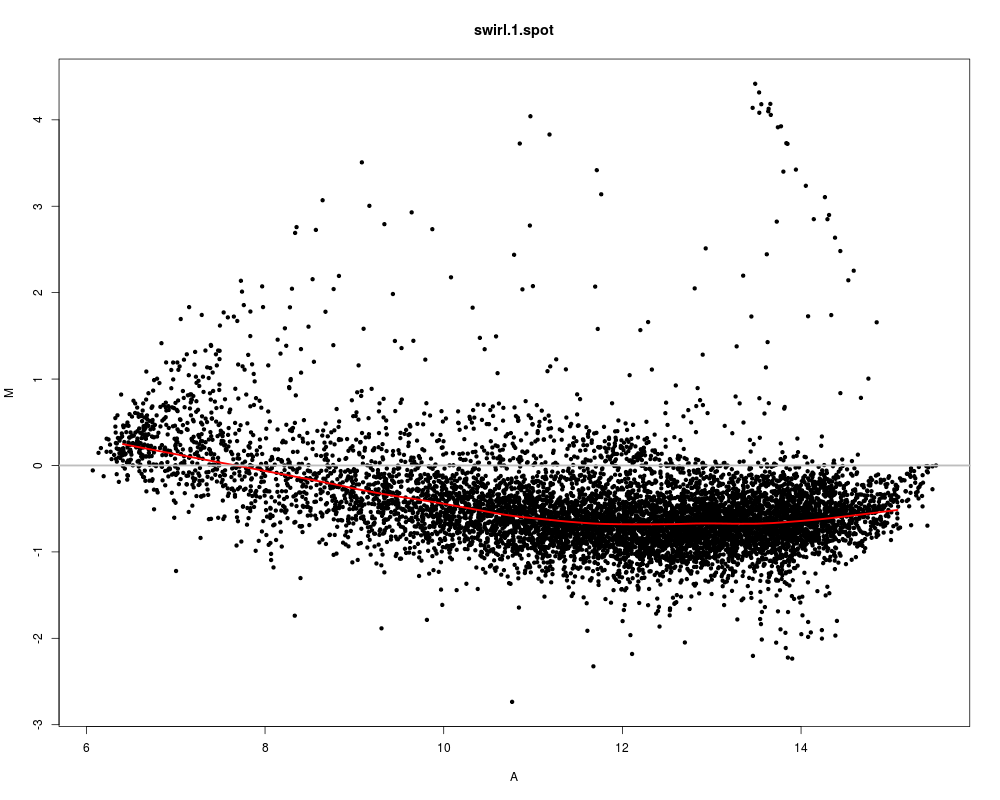
# Lowess fit using all spots
maPlot(swirl, z=NULL, legend.func=NULL)
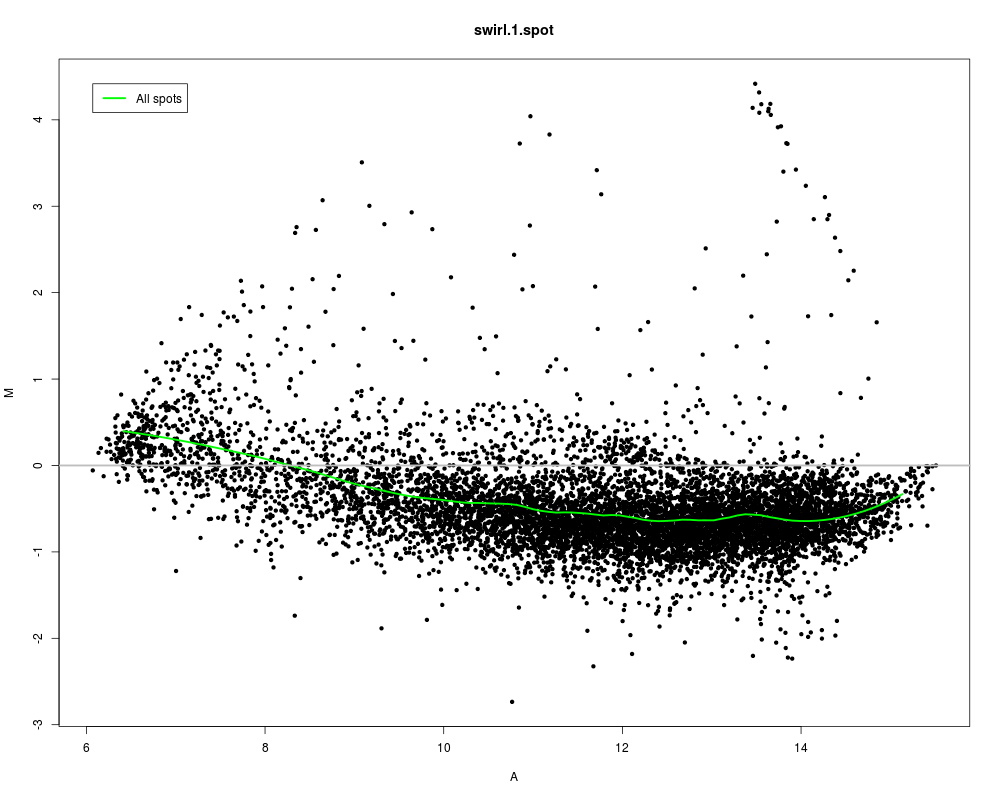
# Loess fit using all spots
maPlot(swirl, z=NULL, legend.func=maLegendLines(legend="All spots",col="green"), lines.func=maLoessLines(loess.args=list(span=0.3),col="green"))
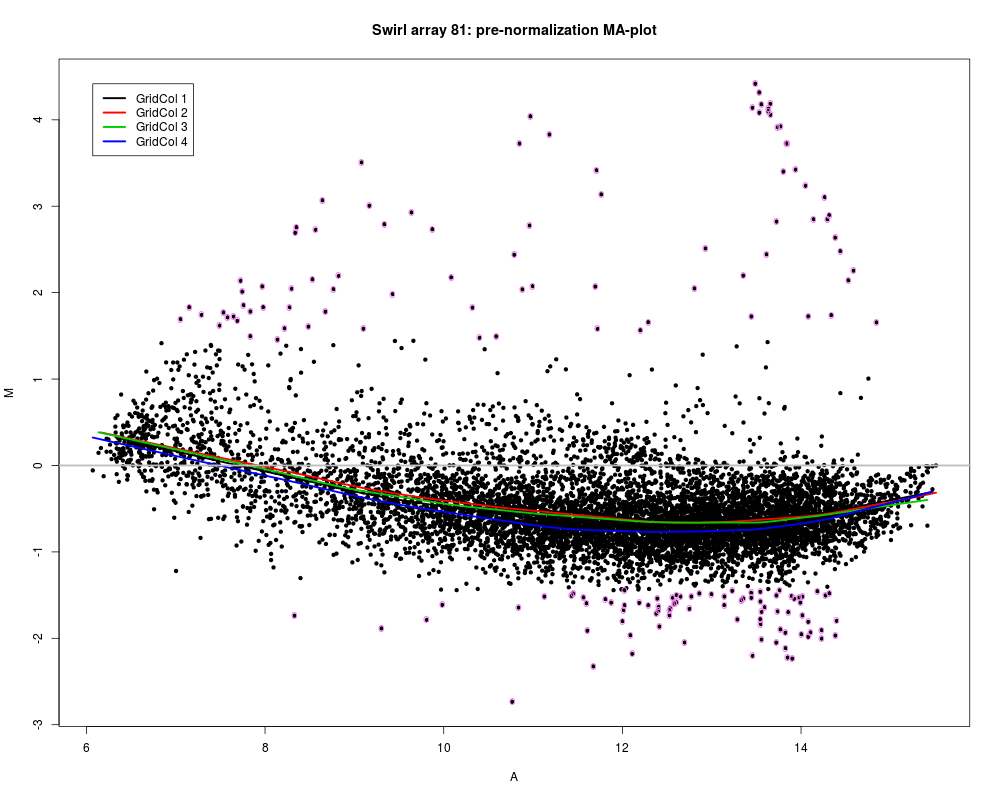
# Pre-normalization MA-plot for the Swirl 81 array, with the lowess fits for
# individual grid columns and 1% tails of M highlighted
defs <- maDefaultPar(swirl[, 1], x = "maA", y = "maM", z = "maGridCol")
legend.func <- do.call("maLegendLines", defs$def.legend)
lines.func <- do.call("maLowessLines", c(list(TRUE, f = 0.3), defs$def.lines))
text.func<-maText(subset=maTop(maM(swirl)[,1],h=0.01,l=0.01), labels="o", col="violet")
maPlot(swirl[, 1], x = "maA", y = "maM", z = "maGridCol", lines.func=lines.func, text.func = text.func, legend.func=legend.func, main = "Swirl array 81: pre-normalization MA-plot")
Results
R version 3.3.1 (2016-06-21) -- "Bug in Your Hair"
Copyright (C) 2016 The R Foundation for Statistical Computing
Platform: x86_64-pc-linux-gnu (64-bit)

R is free software and comes with ABSOLUTELY NO WARRANTY.
You are welcome to redistribute it under certain conditions.
Type 'license()' or 'licence()' for distribution details.

R is a collaborative project with many contributors.
Type 'contributors()' for more information and
'citation()' on how to cite R or R packages in publications.

Type 'demo()' for some demos, 'help()' for on-line help, or
'help.start()' for an HTML browser interface to help.
Type 'q()' to quit R.

> library(marray)
Loading required package: limma
> png(filename="/home/ddbj/snapshot/RGM3/R_BC/result/marray/maPlot.Rd_%03d_medium.png", width=480, height=480)
> ### Name: maPlot
> ### Title: Scatter-plots for cDNA microarray spot statistics
> ### Aliases: maPlot
> ### Keywords: hplot
>
> ### ** Examples
>
> # To see the demo type demo(marrayPlots)
>
> # Examples use swirl dataset, for description type ? swirl
> data(swirl)
>
> # - Default arguments
> maPlot(swirl)
>
> # Lowess fit using all spots
> maPlot(swirl, z=NULL, legend.func=NULL)
>
> # Loess fit using all spots
> maPlot(swirl, z=NULL, legend.func=maLegendLines(legend="All spots",col="green"), lines.func=maLoessLines(loess.args=list(span=0.3),col="green"))
>
> # Pre-normalization MA-plot for the Swirl 81 array, with the lowess fits for
> # individual grid columns and 1% tails of M highlighted
> defs <- maDefaultPar(swirl[, 1], x = "maA", y = "maM", z = "maGridCol")
> legend.func <- do.call("maLegendLines", defs$def.legend)
> lines.func <- do.call("maLowessLines", c(list(TRUE, f = 0.3), defs$def.lines))
> text.func<-maText(subset=maTop(maM(swirl)[,1],h=0.01,l=0.01), labels="o", col="violet")
> maPlot(swirl[, 1], x = "maA", y = "maM", z = "maGridCol", lines.func=lines.func, text.func = text.func, legend.func=legend.func, main = "Swirl array 81: pre-normalization MA-plot")
>
>
>
>
>
> dev.off()
null device
          1
>
|