Supported by Dr. Osamu Ogasawara and  . . |
|
Last data update: 2014.03.03 |
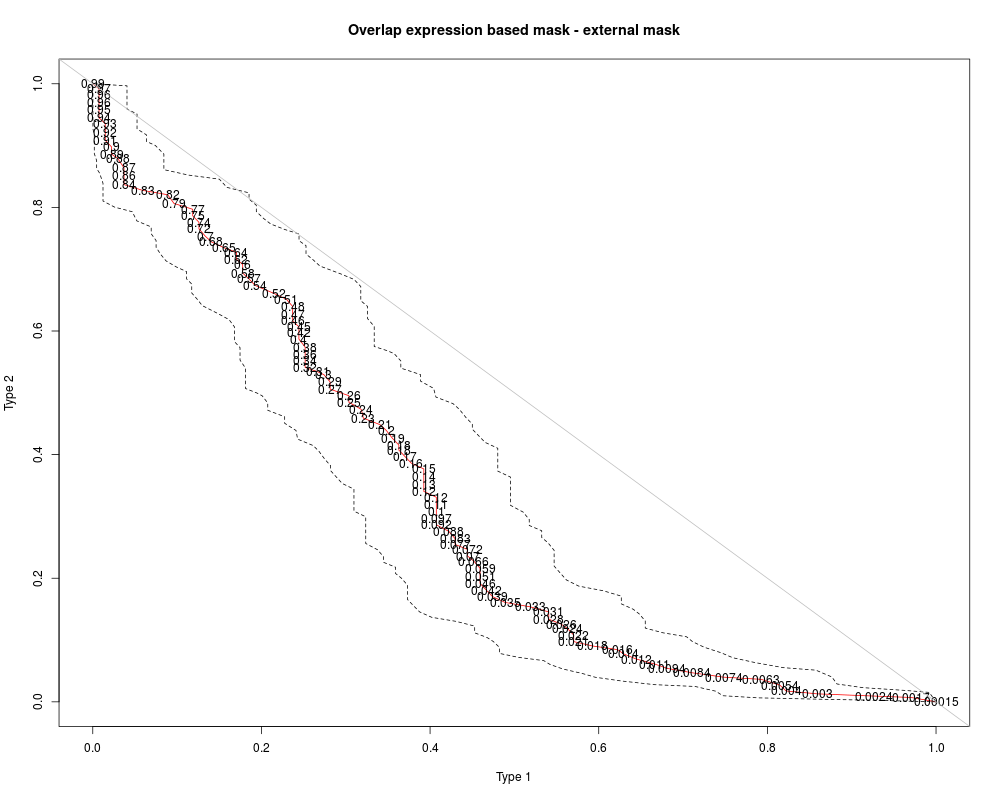
Error Analysis of Masking ResultsDescriptionExpression mask results for a range of cutoff values are compared with an external mask (for example a mask based on sequence data) and type 1 and type 2 errors are estimated. UsageoverlapExprExtMasks(probes,seqdata,cutoffs="none",wilcox.ks=FALSE,sample=10,plotCutoffs=TRUE,verbose=TRUE) Arguments
DetailsThe function ValueA list of five objects will be returned.
Author(s)Michael Dannemann ReferencesDannemann et al, The effects of probe binding affinity differences on gene expression measurements and how to deal with them. Bioinformatics 2009 See Also
Examples
## loading mask on all genes (exmask1) of the same dataset
data(exmask)
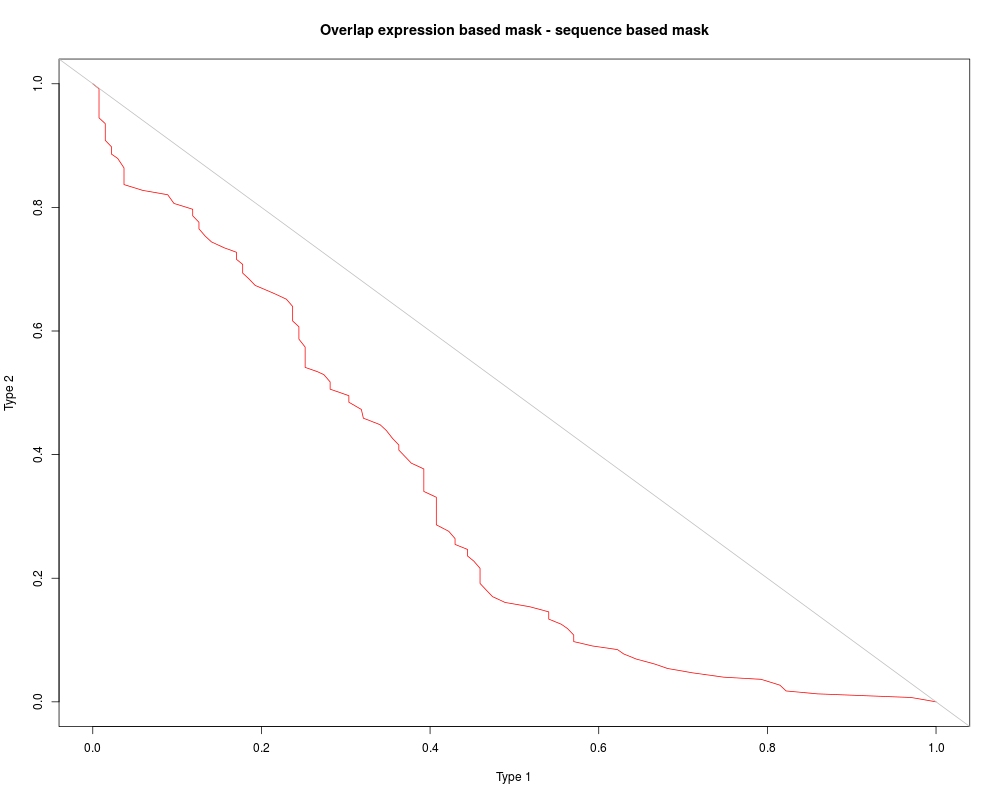
overlapExSeq <- overlapExprExtMasks(exmask$probes[,1:3],sequenceMask[,c(1,2,4)])
## plot results
plot(overlapExSeq$type1,overlapExSeq$type2,type="l",col="red",
main="Overlap expression based mask - sequence based mask",xlab="Type 1",ylab="Type 2")
abline(1,-1,col="gray")
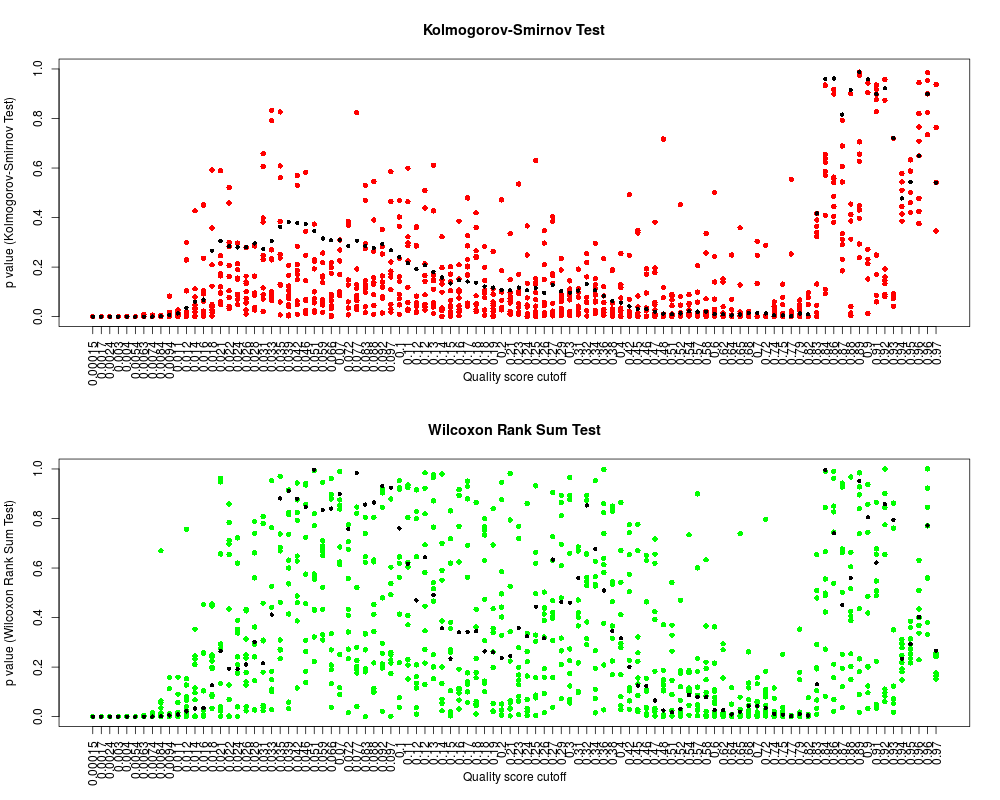
## performing wilcoxon rank sum test and Kolmogorov-Smirnov test on
## expression mask with all genes (exmask)
overlapTests <-
overlapExprExtMasks(exmask$probes[,1:3],sequenceMask[,c(1,2,4)],wilcox.ks=TRUE)
layout(matrix(1:2,ncol=1))
plot(overlapTests$testCutoff[[1]],overlapTests$ksBoot,col="red",main="Kolmogorov-Smirnov Test",xlab="Quality score cutoff",
ylab="p value (Kolmogorov-Smirnov Test)",ylim=c(0,1),pch=16,xaxt="n")
axis(1,at=1:length(unique(overlapTests$testCutoff[[2]])),labels=signif(unique(overlapTests$testCutoff[[2]]),2),las=3)
lines(which(unique(overlapTests$testCutoff[[2]]) %in% overlapTests$testCutoff[[2]]),overlapTests$ksP[!is.na(overlapTests$ksP)],type="p",pch=16,cex=0.8)
plot(overlapTests$testCutoff[[1]],overlapTests$wilcoxonBoot,col="green",main="Wilcoxon Rank Sum Test",xlab="Quality score cutoff",
ylab="p value (Wilcoxon Rank Sum Test)",ylim=c(0,1),pch=16,xaxt="n")
axis(1,at=1:length(unique(overlapTests$testCutoff[[2]])),labels=signif(unique(overlapTests$testCutoff[[2]]),2),las=3)
lines(which(unique(overlapTests$testCutoff[[2]]) %in% overlapTests$testCutoff[[2]]),overlapTests$wilcoxonP[!is.na(overlapTests$wilcoxonP)],type="p",pch=16,cex=0.8)
Results
R version 3.3.1 (2016-06-21) -- "Bug in Your Hair"
Copyright (C) 2016 The R Foundation for Statistical Computing
Platform: x86_64-pc-linux-gnu (64-bit)

R is free software and comes with ABSOLUTELY NO WARRANTY.
You are welcome to redistribute it under certain conditions.
Type 'license()' or 'licence()' for distribution details.

R is a collaborative project with many contributors.
Type 'contributors()' for more information and
'citation()' on how to cite R or R packages in publications.

Type 'demo()' for some demos, 'help()' for on-line help, or
'help.start()' for an HTML browser interface to help.
Type 'q()' to quit R.

> library(maskBAD)
Loading required package: gcrma
Loading required package: affy
Loading required package: BiocGenerics
Loading required package: parallel

Attaching package: 'BiocGenerics'

The following objects are masked from 'package:parallel':

    clusterApply, clusterApplyLB, clusterCall, clusterEvalQ,
    clusterExport, clusterMap, parApply, parCapply, parLapply,
    parLapplyLB, parRapply, parSapply, parSapplyLB

The following objects are masked from 'package:stats':

    IQR, mad, xtabs

The following objects are masked from 'package:base':

    Filter, Find, Map, Position, Reduce, anyDuplicated, append,
    as.data.frame, cbind, colnames, do.call, duplicated, eval, evalq,
    get, grep, grepl, intersect, is.unsorted, lapply, lengths, mapply,
    match, mget, order, paste, pmax, pmax.int, pmin, pmin.int, rank,
    rbind, rownames, sapply, setdiff, sort, table, tapply, union,
    unique, unsplit

Loading required package: Biobase
Welcome to Bioconductor

    Vignettes contain introductory material; view with
    'browseVignettes()'. To cite Bioconductor, see
    'citation("Biobase")', and for packages 'citation("pkgname")'.

> png(filename="/home/ddbj/snapshot/RGM3/R_BC/result/maskBAD/overlapExprExtMasks.Rd_%03d_medium.png", width=480, height=480)
> ### Name: overlapExprExtMasks
> ### Title: Error Analysis of Masking Results
> ### Aliases: overlapExprExtMasks
> ### Keywords: internal
>
> ### ** Examples
>
> ## loading mask on all genes (exmask1) of the same dataset
> data(exmask)
> overlapExSeq <- overlapExprExtMasks(exmask$probes[,1:3],sequenceMask[,c(1,2,4)])
0.99 %  2 %  3 %  4 %  5 %  5.9 %  6.9 %  7.9 %  8.9 %  9.9 %  11 %  12 %  13 %  14 %  15 %  16 %  17 %  18 %  19 %  20 %  21 %  22 %  23 %  24 %  25 %  26 %  27 %  28 %  29 %  30 %  31 %  32 %  33 %  34 %  35 %  36 %  37 %  38 %  39 %  40 %  41 %  42 %  43 %  44 %  45 %  46 %  47 %  48 %  49 %  50 %  50 %  51 %  52 %  53 %  54 %  55 %  56 %  57 %  58 %  59 %  60 %  61 %  62 %  63 %  64 %  65 %  66 %  67 %  68 %  69 %  70 %  71 %  72 %  73 %  74 %  75 %  76 %  77 %  78 %  79 %  80 %  81 %  82 %  83 %  84 %  85 %  86 %  87 %  88 %  89 %  90 %  91 %  92 %  93 %  94 %  95 %  96 %  97 %  98 %  99 %  100 %  >
> ## plot results
> plot(overlapExSeq$type1,overlapExSeq$type2,type="l",col="red",
+      main="Overlap expression based mask - sequence based mask",xlab="Type 1",ylab="Type 2")
> abline(1,-1,col="gray")
>
> ## performing wilcoxon rank sum test and Kolmogorov-Smirnov test on
> ## expression mask with all genes (exmask)
> overlapTests <-
+   overlapExprExtMasks(exmask$probes[,1:3],sequenceMask[,c(1,2,4)],wilcox.ks=TRUE)
0.99 %  2 %  3 %  4 %  5 %  5.9 %  6.9 %  7.9 %  8.9 %  9.9 %  11 %  12 %  13 %  14 %  15 %  16 %  17 %  18 %  19 %  20 %  21 %  22 %  23 %  24 %  25 %  26 %  27 %  28 %  29 %  30 %  31 %  32 %  33 %  34 %  35 %  36 %  37 %  38 %  39 %  40 %  41 %  42 %  43 %  44 %  45 %  46 %  47 %  48 %  49 %  50 %  50 %  51 %  52 %  53 %  54 %  55 %  56 %  57 %  58 %  59 %  60 %  61 %  62 %  63 %  64 %  65 %  66 %  67 %  68 %  69 %  70 %  71 %  72 %  73 %  74 %  75 %  76 %  77 %  78 %  79 %  80 %  81 %  82 %  83 %  84 %  85 %  86 %  87 %  88 %  89 %  90 %  91 %  92 %  93 %  94 %  95 %  96 %  97 %  98 %  99 %  100 %  > layout(matrix(1:2,ncol=1))
> plot(overlapTests$testCutoff[[1]],overlapTests$ksBoot,col="red",main="Kolmogorov-Smirnov Test",xlab="Quality score cutoff",
+      ylab="p value (Kolmogorov-Smirnov Test)",ylim=c(0,1),pch=16,xaxt="n")
> axis(1,at=1:length(unique(overlapTests$testCutoff[[2]])),labels=signif(unique(overlapTests$testCutoff[[2]]),2),las=3)
> lines(which(unique(overlapTests$testCutoff[[2]]) %in% overlapTests$testCutoff[[2]]),overlapTests$ksP[!is.na(overlapTests$ksP)],type="p",pch=16,cex=0.8)
> plot(overlapTests$testCutoff[[1]],overlapTests$wilcoxonBoot,col="green",main="Wilcoxon Rank Sum Test",xlab="Quality score cutoff",
+      ylab="p value (Wilcoxon Rank Sum Test)",ylim=c(0,1),pch=16,xaxt="n")
> axis(1,at=1:length(unique(overlapTests$testCutoff[[2]])),labels=signif(unique(overlapTests$testCutoff[[2]]),2),las=3)
> lines(which(unique(overlapTests$testCutoff[[2]]) %in% overlapTests$testCutoff[[2]]),overlapTests$wilcoxonP[!is.na(overlapTests$wilcoxonP)],type="p",pch=16,cex=0.8)
>
>
>
>
>
>
> dev.off()
null device
          1
>
|