Supported by Dr. Osamu Ogasawara and  . . |
|
Last data update: 2014.03.03 |
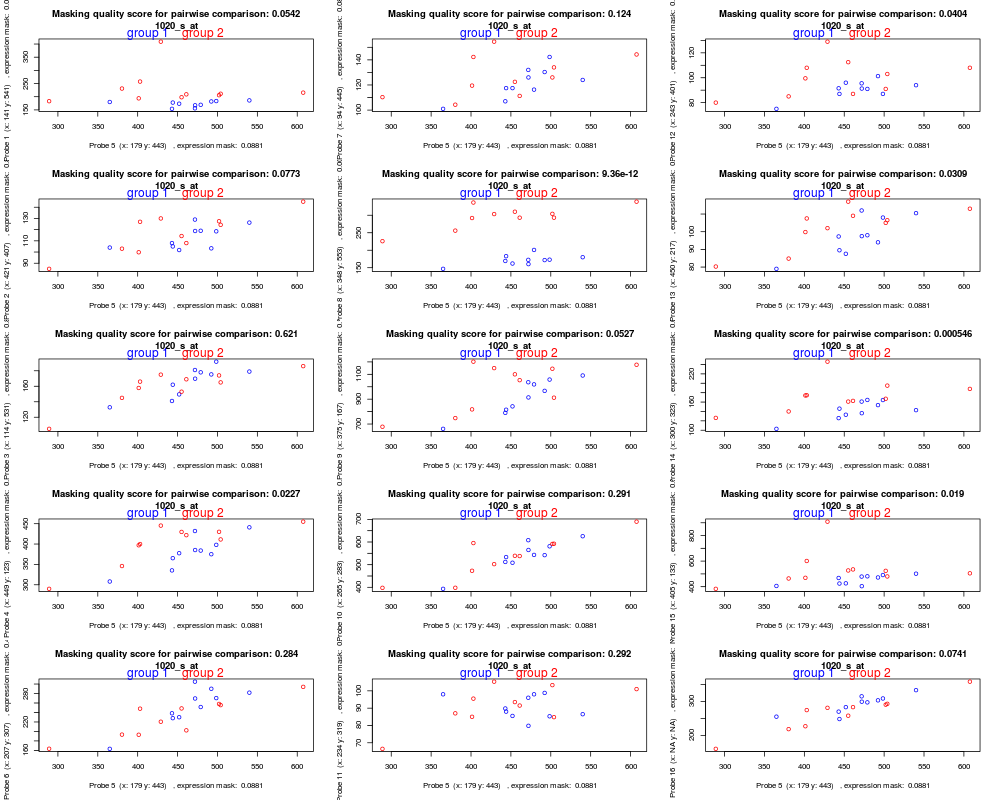
Plot probesDescriptionPairwise plot probes of a probeset. UsageplotProbe(affy,probeset,probe=NA,probeXY=NA,scan=TRUE,ind,exmask="none",seqmask="none",names=FALSE) Arguments
Details The function Author(s)Michael Dannemann ReferencesDannemann et al, The effects of probe binding affinity differences on gene expression measurements and how to deal with them. Bioinformatics 2009 See Also
Examplesdata(exmask) data(AffyBatch) ## plot for one probe comparisons with other probes of the probeset ## for a random probeset availableProbesets <- as.character(unique(exmask$probes[,4])) availableProbesets ## scan the plots ## Not run: plotProbe(affy=newAffyBatch,probeset=availableProbesets[22],probe=5,scan=TRUE,ind=rep(1:2,each=10),exmask=exmask$probes,seqmask=sequenceMask) ## scan with names=TRUE ## Not run: plotProbe(affy=newAffyBatch,probeset=availableProbesets[22],probe=5,scan=TRUE,ind=rep(1:2,each=10),exmask=exmask$probes,seqmask=sequenceMask,names=TRUE) ## plot with given x y information ## Not run: plotProbe(affy=newAffyBatch,probeset=availableProbesets[22],probeXY="313.415",scan=TRUE,ind=rep(1:2,each=10),exmask=exmask$probes,seqmask=sequenceMask,names=TRUE) ## all plots in one layout plotProbe(affy=newAffyBatch,probeset=availableProbesets[22],probe=5,scan=FALSE,ind=rep(1:2,each=10),exmask=exmask$probes,seqmask=sequenceMask) Results
R version 3.3.1 (2016-06-21) -- "Bug in Your Hair"
Copyright (C) 2016 The R Foundation for Statistical Computing
Platform: x86_64-pc-linux-gnu (64-bit)

R is free software and comes with ABSOLUTELY NO WARRANTY.
You are welcome to redistribute it under certain conditions.
Type 'license()' or 'licence()' for distribution details.

R is a collaborative project with many contributors.
Type 'contributors()' for more information and
'citation()' on how to cite R or R packages in publications.

Type 'demo()' for some demos, 'help()' for on-line help, or
'help.start()' for an HTML browser interface to help.
Type 'q()' to quit R.

> library(maskBAD)
Loading required package: gcrma
Loading required package: affy
Loading required package: BiocGenerics
Loading required package: parallel

Attaching package: 'BiocGenerics'

The following objects are masked from 'package:parallel':

    clusterApply, clusterApplyLB, clusterCall, clusterEvalQ,
    clusterExport, clusterMap, parApply, parCapply, parLapply,
    parLapplyLB, parRapply, parSapply, parSapplyLB

The following objects are masked from 'package:stats':

    IQR, mad, xtabs

The following objects are masked from 'package:base':

    Filter, Find, Map, Position, Reduce, anyDuplicated, append,
    as.data.frame, cbind, colnames, do.call, duplicated, eval, evalq,
    get, grep, grepl, intersect, is.unsorted, lapply, lengths, mapply,
    match, mget, order, paste, pmax, pmax.int, pmin, pmin.int, rank,
    rbind, rownames, sapply, setdiff, sort, table, tapply, union,
    unique, unsplit

Loading required package: Biobase
Welcome to Bioconductor

    Vignettes contain introductory material; view with
    'browseVignettes()'. To cite Bioconductor, see
    'citation("Biobase")', and for packages 'citation("pkgname")'.

> png(filename="/home/ddbj/snapshot/RGM3/R_BC/result/maskBAD/plotProbe.Rd_%03d_medium.png", width=480, height=480)
> ### Name: plotProbe
> ### Title: Plot probes
> ### Aliases: plotProbe
> ### Keywords: internal
>
> ### ** Examples
>
> data(exmask)
> data(AffyBatch)
> ## plot for one probe comparisons with other probes of the probeset
> ## for a random probeset
> availableProbesets <- as.character(unique(exmask$probes[,4]))
> availableProbesets
  [1] "1000_at"   "1001_at"   "1002_f_at" "1003_s_at" "1004_at"   "1005_at"
  [7] "1006_at"   "1007_s_at" "1008_f_at" "1009_at"   "100_g_at"  "1010_at"
 [13] "1011_s_at" "1012_at"   "1013_at"   "1014_at"   "1015_s_at" "1016_s_at"
 [19] "1017_at"   "1018_at"   "101_at"    "1020_s_at" "1021_at"   "1022_f_at"
 [25] "1023_at"   "1024_at"   "1025_g_at" "1026_s_at" "1027_at"   "1028_at"
 [31] "1029_s_at" "102_at"    "1030_s_at" "1031_at"   "1038_s_at" "1039_s_at"
 [37] "1052_s_at" "1058_at"   "1059_at"   "1060_g_at" "1064_at"   "1073_at"
 [43] "1074_at"   "1081_at"   "1091_at"   "1101_at"   "1119_at"   "1122_f_at"
 [49] "1130_at"   "1131_at"   "1134_at"   "113_i_at"  "1147_at"   "1151_at"
 [55] "1154_at"   "1158_s_at" "1160_at"   "1161_at"   "1166_at"   "1173_g_at"
 [61] "1179_at"   "1180_g_at" "1182_at"   "1184_at"   "1191_s_at" "1192_at"
 [67] "1195_s_at" "1199_at"   "1201_at"   "1211_s_at" "1213_at"   "1217_g_at"
 [73] "121_at"    "1235_at"   "1238_at"   "1241_at"   "1248_at"   "1250_at"
 [79] "1251_g_at" "1252_at"   "1253_at"   "1268_at"   "1269_at"   "1270_at"
 [85] "1287_at"   "1288_s_at" "1295_at"   "1307_at"   "1309_at"   "1310_at"
 [91] "1311_at"   "1312_at"   "1313_at"   "1314_at"   "1315_at"   "1316_at"
 [97] "1323_at"   "1336_s_at" "1346_at"   "1355_g_at"
> ## scan the plots
> ## Not run: plotProbe(affy=newAffyBatch,probeset=availableProbesets[22],probe=5,scan=TRUE,ind=rep(1:2,each=10),exmask=exmask$probes,seqmask=sequenceMask)
> ## scan with names=TRUE
> ## Not run: plotProbe(affy=newAffyBatch,probeset=availableProbesets[22],probe=5,scan=TRUE,ind=rep(1:2,each=10),exmask=exmask$probes,seqmask=sequenceMask,names=TRUE)
> ## plot with given x y information
> ## Not run: plotProbe(affy=newAffyBatch,probeset=availableProbesets[22],probeXY="313.415",scan=TRUE,ind=rep(1:2,each=10),exmask=exmask$probes,seqmask=sequenceMask,names=TRUE)
> ## all plots in one layout
> plotProbe(affy=newAffyBatch,probeset=availableProbesets[22],probe=5,scan=FALSE,ind=rep(1:2,each=10),exmask=exmask$probes,seqmask=sequenceMask)
>
>
>
>
> dev.off()
null device
          1
>
|